
Windows Forensics Part 3: Tracking Program Execution with Prefetch
We continue our Windows forensic analysis by further exploring artifacts related to program execution.
After studying ShimCache and then Amcache, we now turn our attention to Prefetch, a mechanism often used to improve system performance, but which also provides valuable information during investigations.
Unlike the previous artifacts, Prefetch can highlight the actual execution of a program, with more precise time-related and contextual information.
The goal of this article is to understand how it works, examine its contents, and see how it can be used to supplement a forensic analysis, especially when correlated with Amcache and ShimCach.
Table of Contents
What is Prefetch?
The Prefetch mechanism was introduced starting with Windows XP to improve system performance. Its purpose is to optimize the loading of files essential to Windows operation, as well as those required to run applications.
Because these files are located in different places on the disk, loading them can slow down system startup and program launches.
Prefetch addresses this constraint by recording information about the files used during execution, so they can load faster on subsequent launches.
This mechanism is still used on modern systems. However, it can be disabled through the following registry key:
HKEY_LOCAL_MACHINE\SYSTEM\CurrentControlSet\Control\Session Manager\Memory Management\PrefetchParameters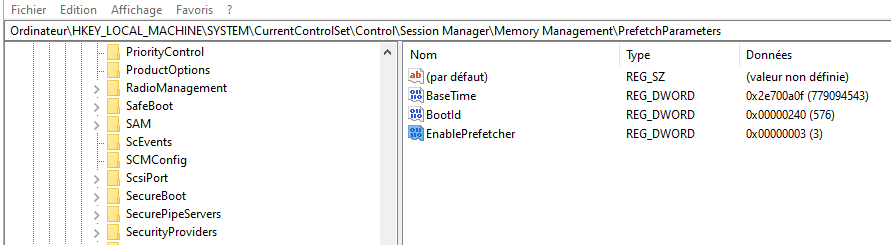
0: Disabled1: Use application prefetch only2: Use boot prefetch only3: Use everything
On Windows Server, this mechanism is generally disabled by default.
As you can see, these files can be a real source of information in forensics, especially for detecting traces of applications executed at system startup, such as rootkits or malicious persistence mechanisms.
Prefetch Structure
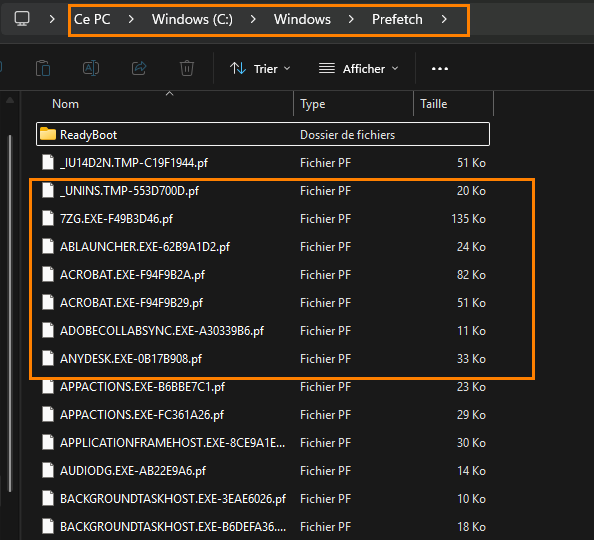
Once enabled, Prefetch content is located in the folder: C:\Windows\Prefetch.
This directory contains two types of files:
- System startup-related files, for example:
NTOSBOOT-B00DFAAD.pf - Application-related files, whose names begin with the name of the executed program (for example:
ACROBAT.EXE-xxxx.pf,7ZIP.EXE-xxxx.pf)
Note that the number of entries is limited to 1024 Prefetch files.
We will now move on to analyzing these files. In some cases, it is also possible to clear Prefetch data present in memory, but that topic will be covered in another article dedicated to memory analysis.
Analyzing the Prefetch File
Rest assured, we will not do without our friend Eric Zimermman. But this time, instead of using a direct advanced parser, we will start with a simple and fast tool for a first overview: WinPrefetchView from the NirSoft suite.
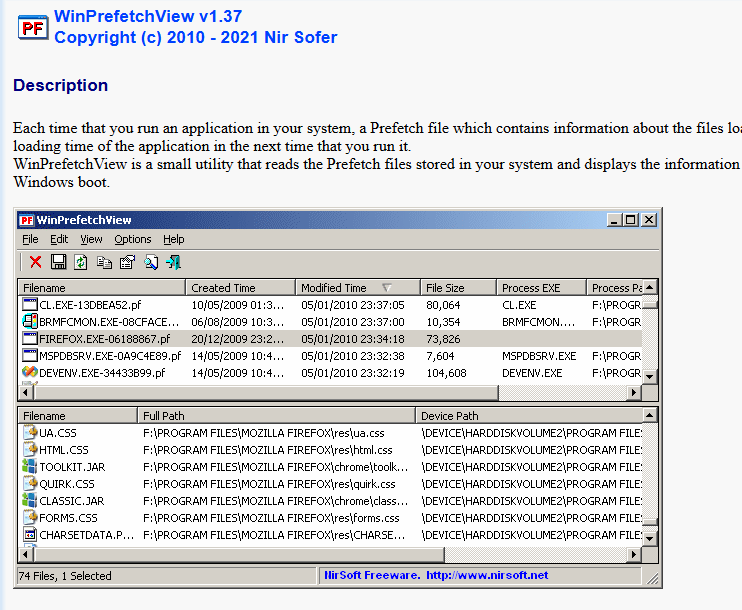
Once downloaded and launched with administrative privileges, the tool will automatically load the Prefetch files
First Look
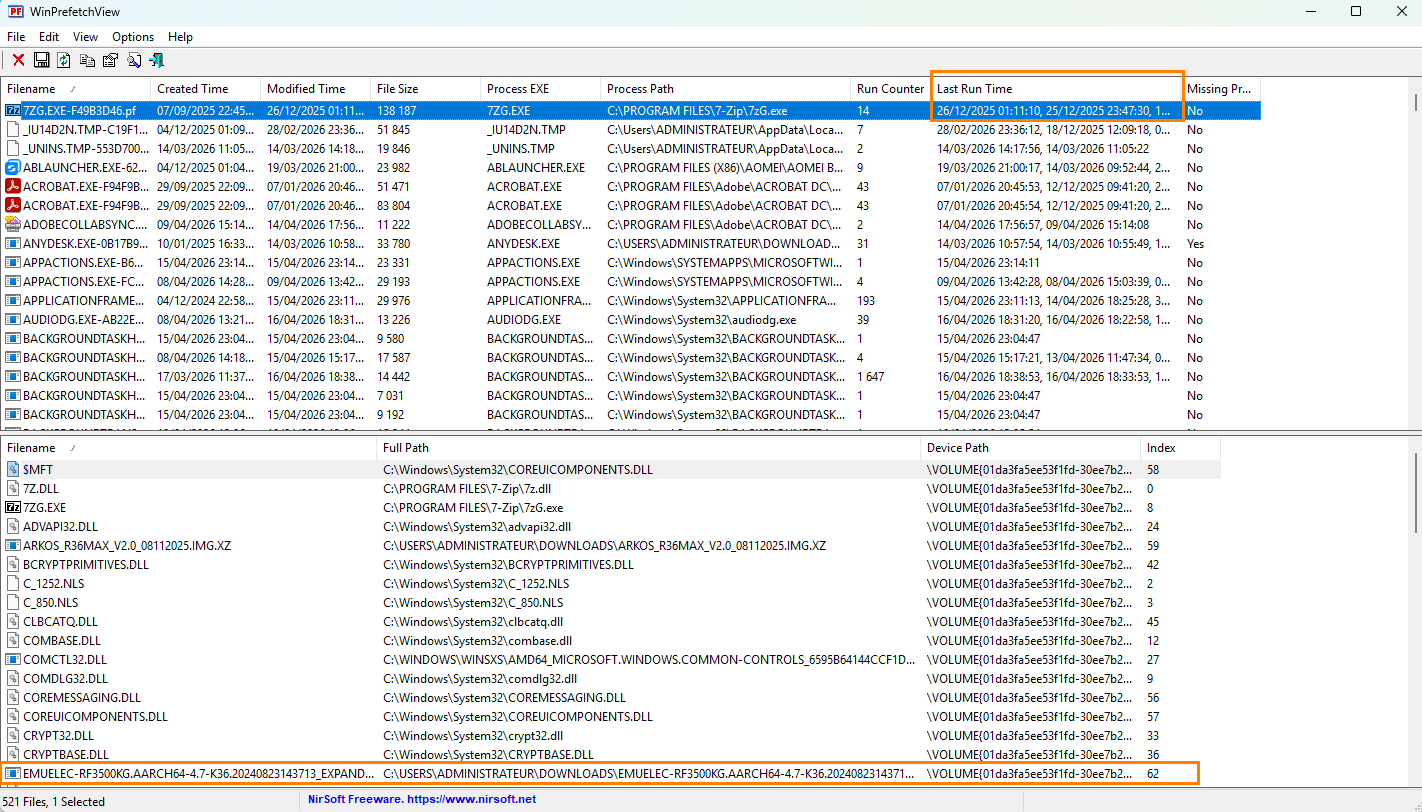
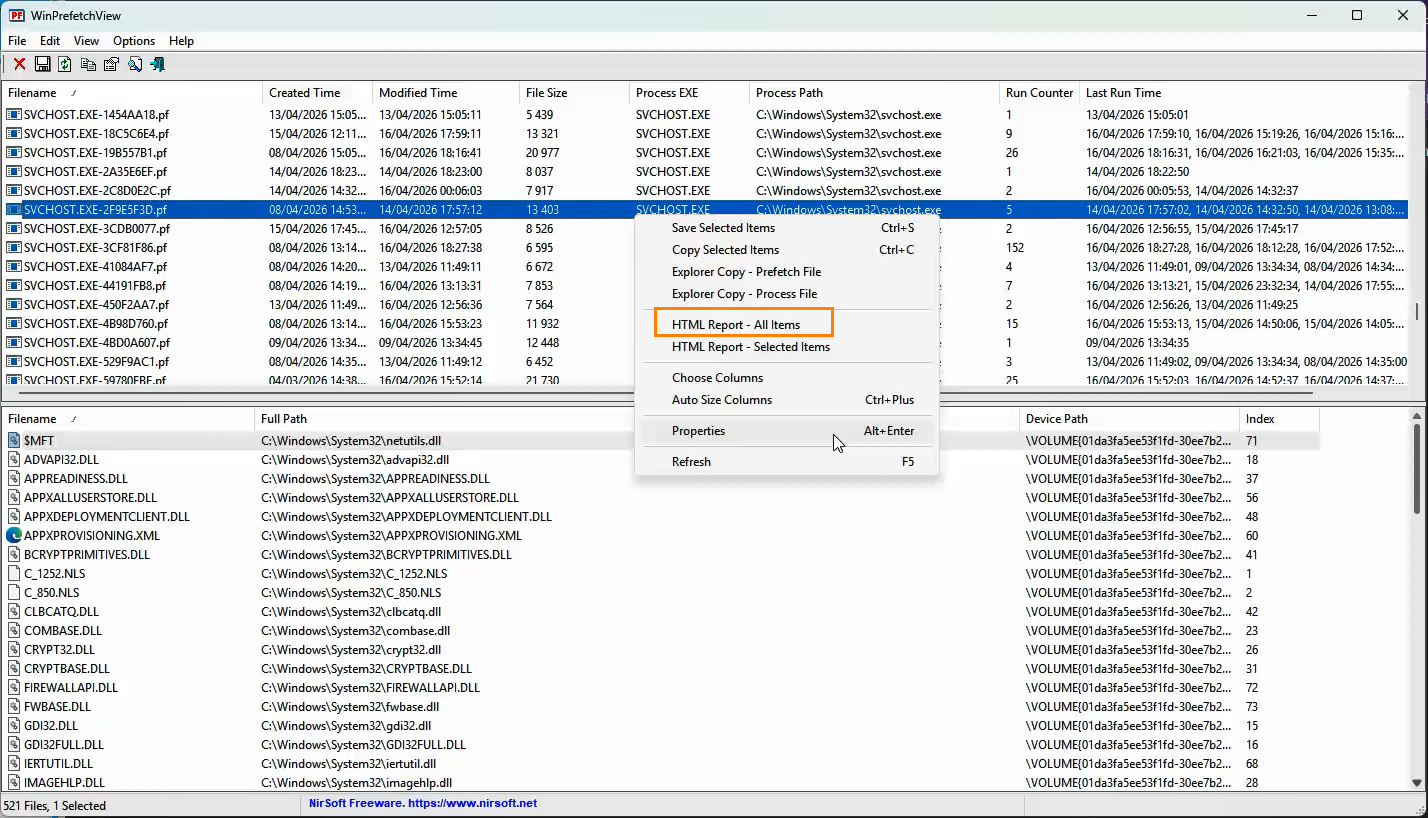
The tool offers a fairly clear view. In the upper section, you can see the executed applications, with information such as:
- The last execution
- The number of launches
- In the lower section, you can see the files called by the application
That is already enough to get a first idea of what is happening on the machine.
In my case, I was able to observe, for example, a Linux system (EmuElec) extracted with 7-Zip, as well as other items such as Kali Linux distributions or more unusual files. This type of information quickly helps guide the analysis.
- Limits of this approach
Even though the view is readable, the analysis quickly becomes tedious. The tool provides information, but not necessarily conclusions. We have to do the correlation work ourselves.
The right reflex here would be to analyze the suspicious dates corresponding to alerts and information found in event logs, EDR, and the Amcache file.
Analysis Example
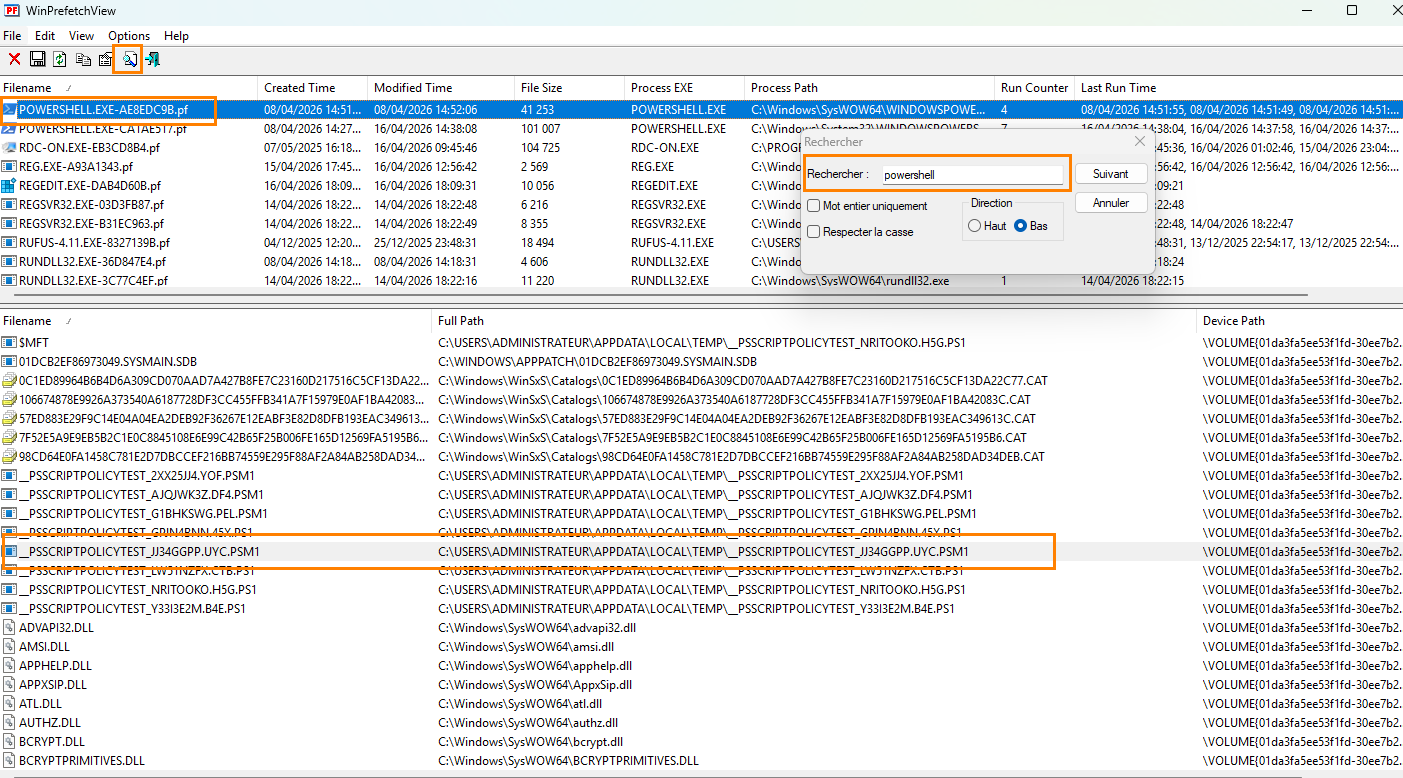
By filtering and searching for sensitive tools (such as PowerShell), we can identify interesting behavior.
In my case, I noticed the loading of a module named PSScriptTest via PowerShell. This type of element can be a lead worth investigating.
In general, it is advisable to set aside system paths and standard Windows binaries at first, and focus on unusual items.
Be careful, however: a system binary is not necessarily legitimate, so its context must always be verified.
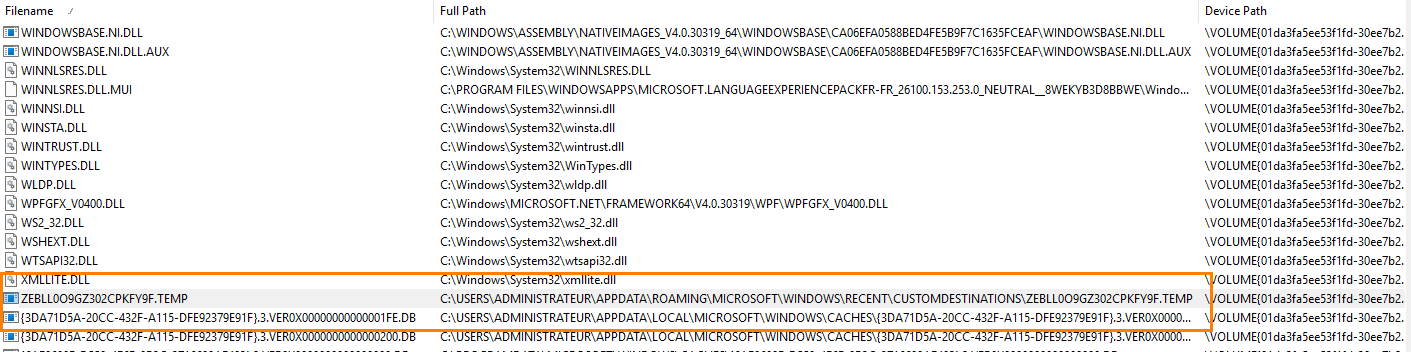
Correlation with Events
As I continued the analysis, I identified a file loaded via PowerShell that matched the date of a suspicious alert generated by the EDR. Even though the machine was not actually compromised, this alert allowed me to reproduce a scenario and write this article.
Additional Checks
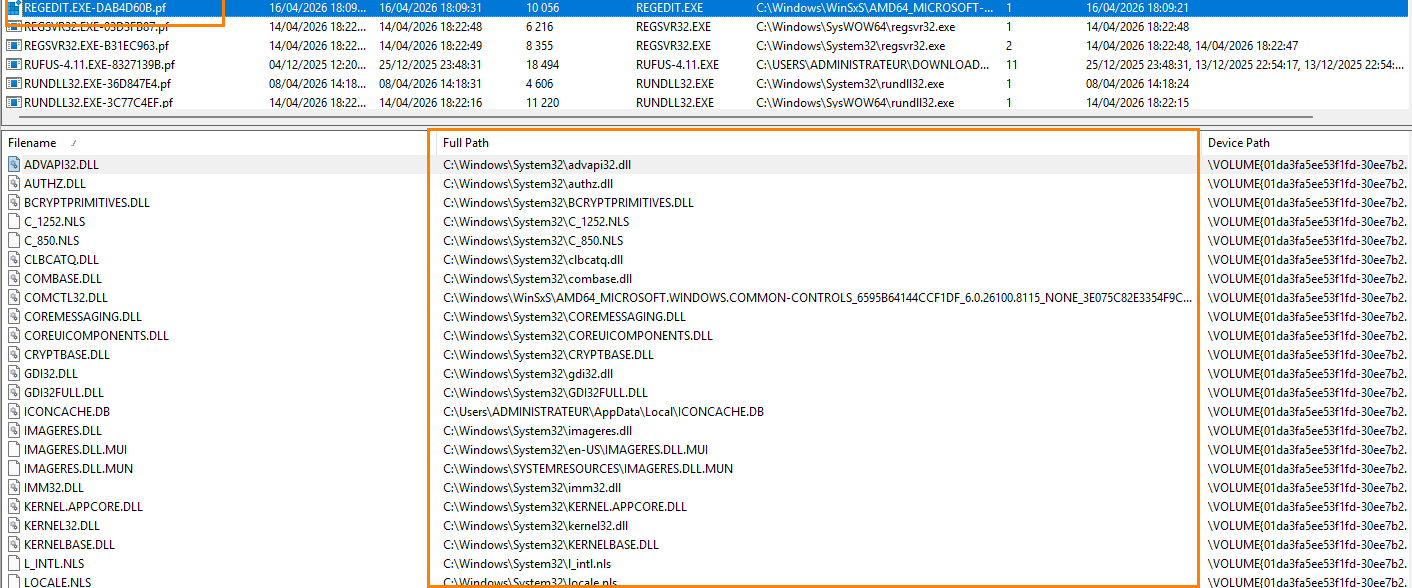
I then turned to the registry, especially the usual persistence locations. Nothing suspicious at first glance, but this step remains essential.
Certain processes should also be checked systematically. Here, no abnormal behavior was observed in the Registry Editor.
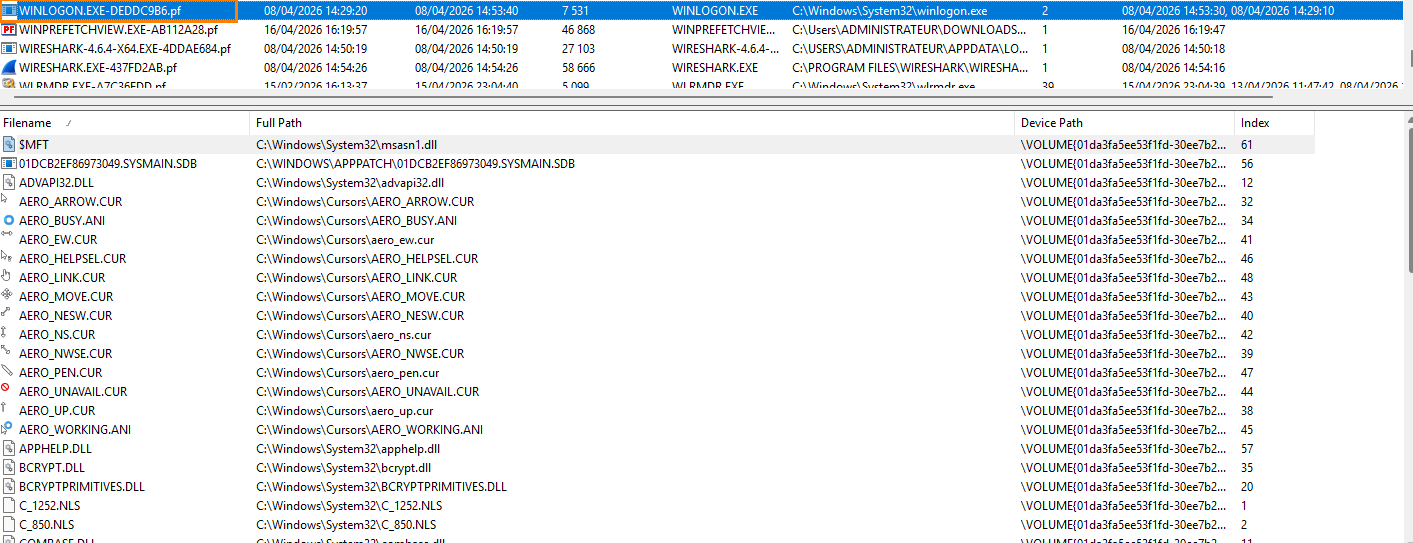
Here, wlrmdr.exe (Windows Logon Reminder) is tied to system activation.
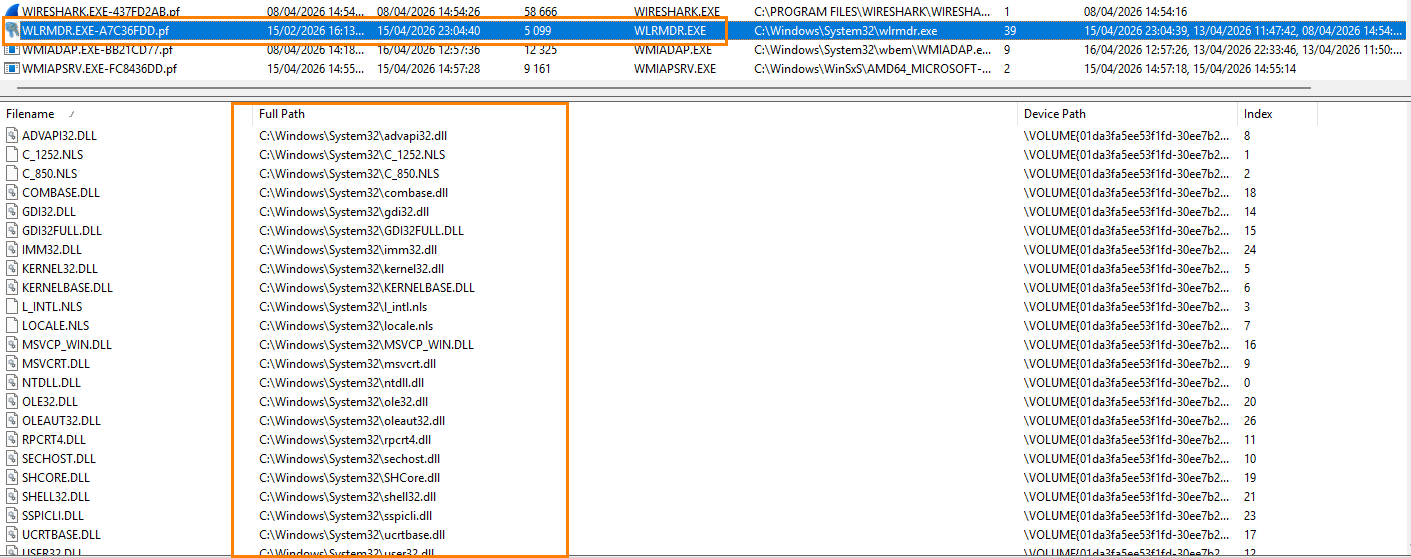
The well-known winlogon.exe process, a frequent target for compromise, must be analyzed carefully; traces may appear in the event of lsass memory dumping.
Exporting Data
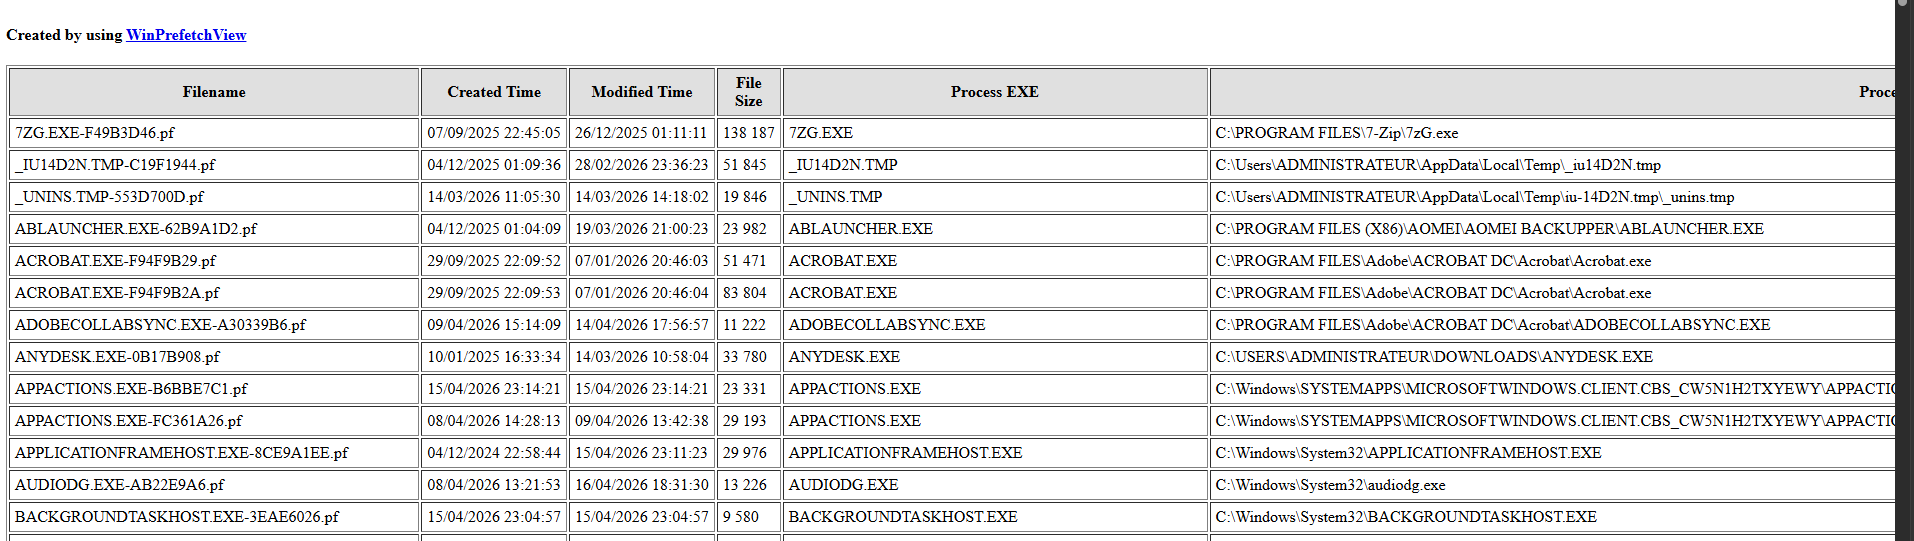
The tool also allows you to copy entries or export results to HTML. Even though HTML export is limited for analysis purposes (sorting is not very convenient), it does preserve a usable timeline.
Below is an example of the HTML output:
Analysis with PECmd
Let us now move on to a more advanced analysis using the PECmd tool, developed by our friend Eric Zimmerman. This tool can read and extract Prefetch file data from the command line, with output in CSV format. This format is especially convenient because it allows you to use Excel filters to refine searches.
Download the PEcmd tool from the link:

After downloading the tool and placing it in a folder, it is possible to analyze a specific Prefetch file using the following command, adjusting the path and file name:
PEcmd.exe –f C:\windows\prefetch\nom_du_fichier.pf –csv C:\temp\ --csvf File1.csv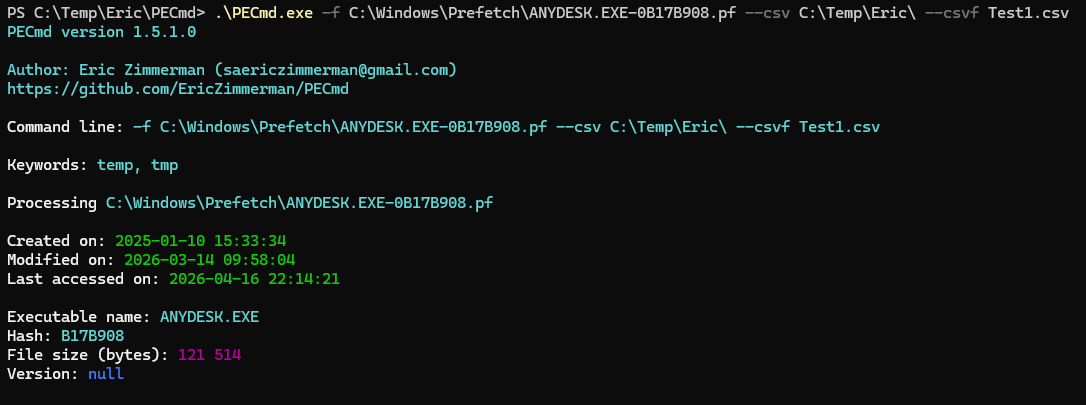
This command generates a CSV file containing the main information from the analyzed file. A first read already provides interesting elements, especially regarding application execution

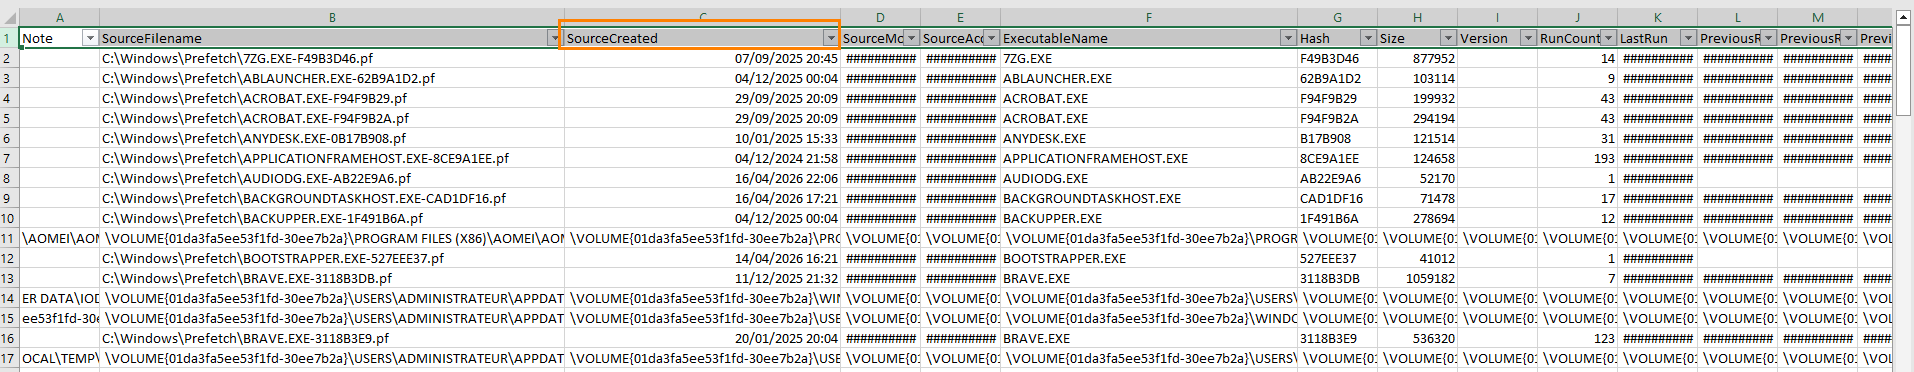
To go further, it is possible to analyze all Prefetch files present on the system. At that point, the tool really comes into its own, especially for a global analysis.
PEcmd.exe –f C:\windows\prefetch\ –csv C:\temp\ --csvf File2.csv
The generated file groups together all information extracted from the Prefetch files. It then becomes possible to apply filters and cross-reference the data to surface relevant elements.
Conclusion
As we have just seen, no element should be overlooked in forensics. Every piece of information can provide a lead and contribute to the overall understanding of an incident.
Prefetch files mainly make it possible to confirm application execution, especially in scenarios involving persistence mechanisms such as code injection or the use of malicious startup programs. They must, however, be correlated with the other artifacts discussed previously in order to obtain a coherent analysis.
It is also important to note that the time information from Prefetch is generally less precise than that provided by Amcache.
We will continue in a future article with other complementary mechanisms, in order to go even deeper into system analysis.