www.it-connect.fr

Sniffnet: A Free Open Source Network Monitor for Windows, Linux, and macOS
Your computer is constantly communicating on the network, even when you are doing nothing (and especially if you use Windows). To find out who it is exchanging data with, which applications are opening those connections, and which countries your packets are going to, there is a free, open source, and easy-to-use tool: Sniffnet. In this tutorial, I’ll show you this network analyzer, install it on Windows, and then walk through its interface and options so you can, perhaps, detect a suspicious connection.
Sniffnet in a nutshell
Sniffnet is a free and open source network traffic monitor, developed in Rust and available on Windows, macOS, and Linux. It captures traffic from a network adapter and displays, in real time, the contacted hosts (with their domain, country, and ASN), the services in use, and, since version 1.5, the programs behind the connections. It also lets you apply BPF filters, export the capture to PCAP for Wireshark, and receive alerts when the machine exchanges data with an IP address present in a blacklist.
To use it, the steps are as follows:
- Download the package suitable for your system from the official Sniffnet website.
- On Windows, also install Npcap, the capture library Sniffnet depends on.
- Launch Sniffnet, select your network adapter, and click on Start.
- Explore the traffic from the overview, then refine it with the Inspect tab.
What is Sniffnet?
A network analyzer designed to be accessible
Sniffnet is a network analyzer, just like Wireshark. Its special feature is its approach: whereas most tools of this kind require a certain technical background to be fully used, Sniffnet focuses on user experience. The interface is graphical, information is pre-filled, and most actions are done in one click.
Sniffnet lets you:
- Choose the network adapter to monitor, or import an existing PCAP file.
- View real-time traffic statistics and graphs for inbound and outbound traffic.
- Identify remote hosts with their domain name, ASN, and geographic location.
- Recognize more than 6,000 services and protocols.
- See which programs on the machine are using the network connection.
- Inspect each connection in detail and filter it according to different criteria.
- Export the capture in PCAP format.
- Import an IP blacklist and receive notifications on defined events.
What is an ASN? An Autonomous System Number identifies the entity that operates a block of IP addresses on the Internet: a hosting provider, an ISP, or a major platform. This is what makes it possible to know whether a connection is going to Microsoft, Amazon, Google, or Cloudflare, even when the domain name is not obvious.
Sniffnet is developed by Giuliano Bellini and is entirely written in Rust. It is free, and there is no paid edition. It has been translated into 26 languages, including French. At the time of writing, the latest available version is 1.5.1, released in July 2026. It notably introduced connection latency display and support for CIDR ranges in IP blacklists.
Here are the official resources:
- Official Sniffnet website
- Sniffnet GitHub repository
- Sniffnet Wiki (the user manual)
Sniffnet vs Wireshark: what’s the difference?
Sniffnet and Wireshark are both network analyzers that rely on the same capture mechanism (libpcap, or Npcap on Windows). Wireshark goes much further, since it dissects each packet protocol by protocol, but it is also much more complex to use. Sniffnet aims to be more approachable: it works at the connection level (who is talking to whom, how much, on which service, and from which program) rather than at the packet payload level.
| Criterion | Sniffnet | Wireshark |
|---|---|---|
| Analysis level | Connections, hosts, services, programs | Packets, protocol-by-protocol dissection |
| Ease of use | Simple, everything is pre-filled | Demanding, requires network knowledge |
| Program behind the traffic | Yes (since version 1.5) | No |
| Host country, domain, and ASN | Yes, natively | Partially, depending on configuration |
| Filters | BPF filters at capture time, display filters in Inspect | Rich BPF capture filters and display filters |
| Packet content | No | Yes |
| Capture format | PCAP export | PCAP and PCAPng |
The two tools are complementary: Sniffnet helps you quickly spot an interesting connection, and Wireshark then lets you dissect it thanks to the PCAP export.
Installing Sniffnet
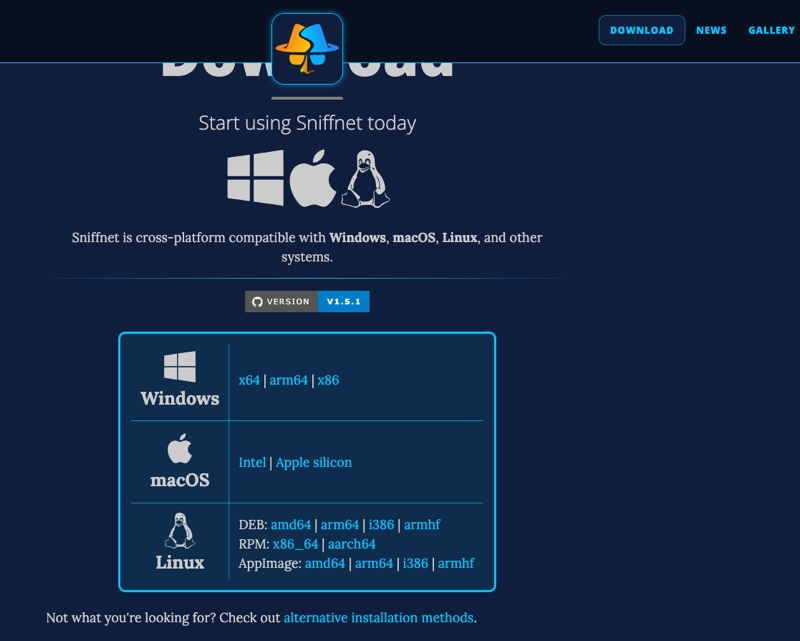
To install Sniffnet, go to the official website and open the Download section. There you will find the installation package suited to your system:
- Windows: an MSI package for x64, arm64, and x86 architectures.
- macOS: a DMG image for Intel Macs and Apple Silicon Macs.
- Linux: DEB, RPM, and AppImage packages, for several architectures (amd64, arm64, i386, armhf).
Note: other installation methods are available, notably via Homebrew, Scoop, Cargo, or the repositories of certain Linux distributions (Arch Linux, FreeBSD, NetBSD, etc.). They are listed in the official wiki.
Installing Sniffnet and Npcap on Windows
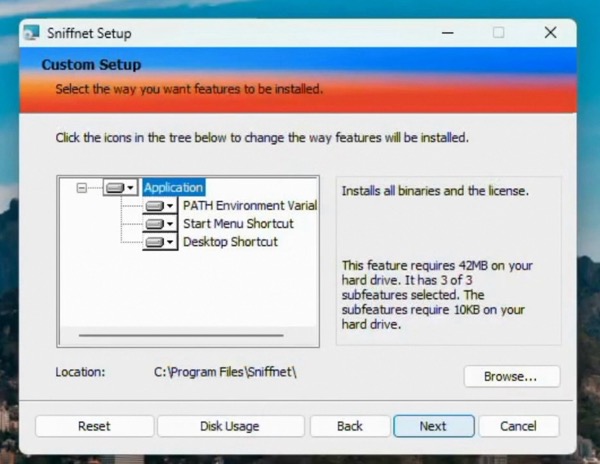
On Windows, installing Sniffnet is straightforward: launch the MSI package, follow the wizard, and confirm the installation. By default, the application is installed in C:\Program Files\Sniffnet\, with a shortcut on the Desktop and in the Start menu. At the end of the installation, the wizard displays an important message: the application needs Npcap to work.
If you stop there and Npcap is not present on the machine, Sniffnet refuses to start and displays the following error: "The code execution cannot proceed because wpcap.dll was not found. Reinstalling the program may fix this problem.". Reinstalling Sniffnet will not change anything: the missing wpcap.dll file is provided by Npcap.
What is Npcap? Npcap is the packet capture library for Windows maintained by the Nmap project. It relies on a kernel driver and on the libpcap library to allow applications to capture raw network traffic. It is also the dependency used by Wireshark: if Wireshark is already installed on your machine, Npcap is probably already there too.
To fix the issue, download the installer from the official Npcap website, then run it. The Sniffnet wiki asks you to check the Install Npcap in WinPcap API-compatible Mode option during installation.
Installing Sniffnet on macOS and Linux
On macOS, there is no dependency to install because the system already includes everything required. However, Sniffnet is not notarized by Apple, so Gatekeeper blocks its first launch with the message "Apple could not verify that Sniffnet.app is free of malware". To unblock it, close this message with Done, then go to System Settings > Privacy & Security and there you will be able to allow Sniffnet.
Sniffnet must also be run with administrator privileges to analyze the network adapter activity. If you install it with Homebrew, launch it from Terminal with the following command:
# Installer Sniffnet avec Homebrew
brew install sniffnet

# Lancer Sniffnet avec les privilèges administrateur
sudo sniffnet
On Linux, capture relies on libpcap. If you do not run the application as root, you must grant the required capabilities to the executable:
# Autoriser Sniffnet à capturer le trafic sans être lancé en root
sudo setcap cap_net_raw,cap_net_admin=eip /chemin/vers/sniffnet

# Alternative : lancer Sniffnet avec sudo (obligatoire avec l'AppImage)
sudo -E sniffnet
For the rest of this article, I will use Sniffnet on a Windows 11 virtual machine.
Starting a first capture with Sniffnet
Choosing the network adapter to analyze
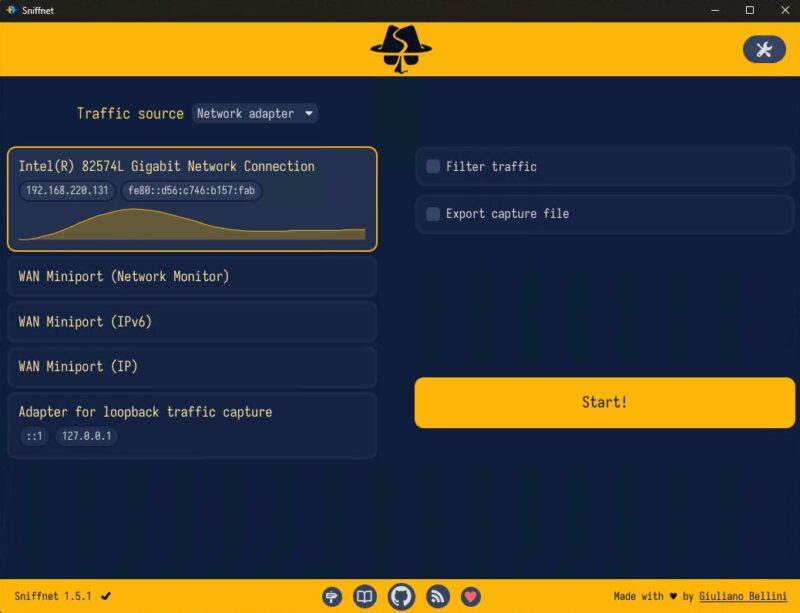
When Sniffnet starts, it feels a bit like Wireshark: you first need to select the network adapter from which the traffic originates. The list shows the machine’s physical and virtual adapters, with their IPv4 and IPv6 addresses and a small graph of activity over the last 30 seconds. It is sorted by recent traffic volume, so the most active adapter appears first, and Sniffnet remembers your choice from one launch to the next.
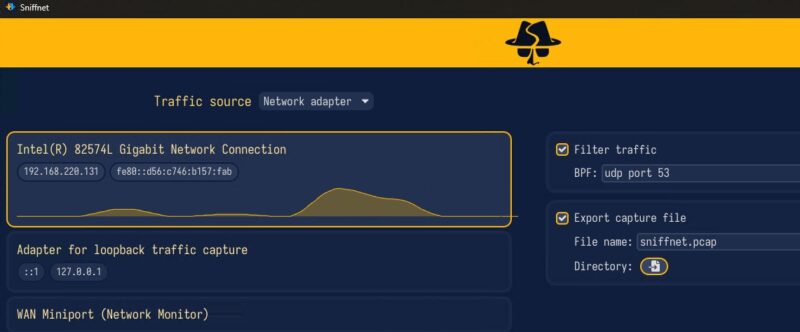
Here, I select my Intel(R) 82574L Gigabit Network Connection adapter. You will also notice the Traffic source menu, which lets you switch from the network adapter to a capture file (Capture file) to analyze an existing PCAP file, as well as the Filter traffic and Export capture file options, which we will come back to. To start the capture, click the Start button.
The overview: hosts, services, and programs
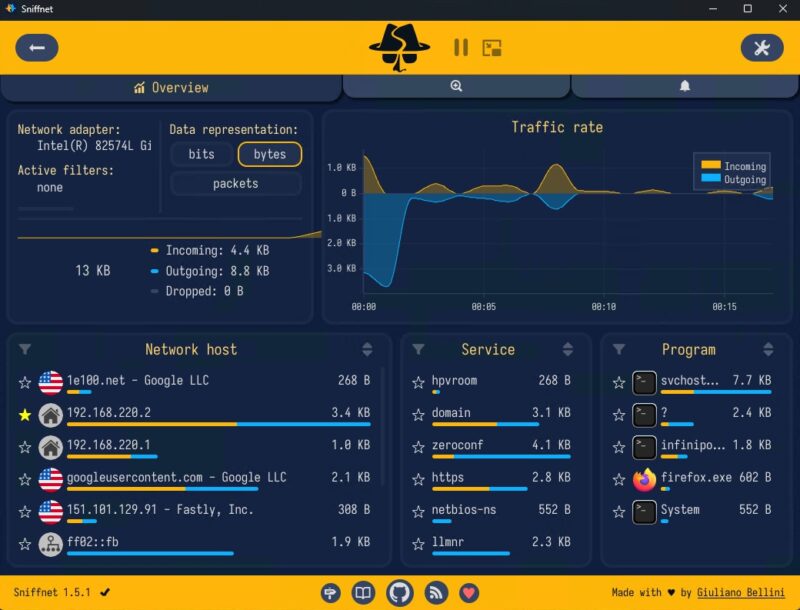
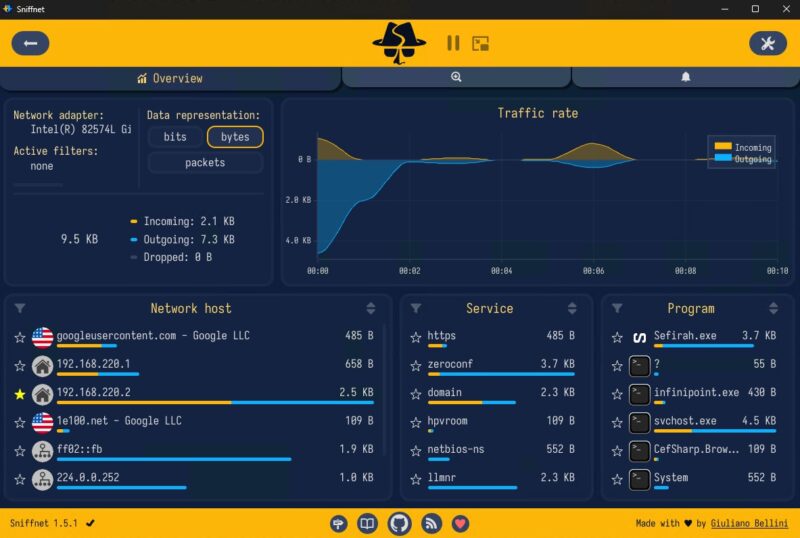
Network traffic starts appearing in real time. Naturally, on a Windows machine, there is a lot of chatter, especially if a few applications are installed. The overview is split up as follows:
- Top left: capture statistics, with inbound, outbound, and lost data volume.
- Top: the real-time throughput graph, in bytes or packets depending on the selected representation.
- Network host: the list of hosts with which the machine exchanges data, with the country flag, domain name, and ASN (for example
googleusercontent.com - Google LLC). - Service: the corresponding services (
https,domainfor DNS,netbios-ns,llmnr, etc.). - Program: the programs behind the traffic.
This is where Sniffnet becomes really interesting: it links network connections, services, and programs together. For example, you can see that msedge.exe, svchost.exe, OneDrive.Sync.Service.exe, or even DeepL.exe are communicating over the network. To identify the programs, Sniffnet correlates different system information, such as process IDs, executable paths, and open network ports.
Inspecting network connections
Filter by program, domain, country, or ASN
If you click on a program in the list, for example Microsoft Edge (msedge.exe), you are redirected to the Inspect tab, represented by a magnifying glass. The Program filter is then pre-filled, and you only see the connections associated with that program.
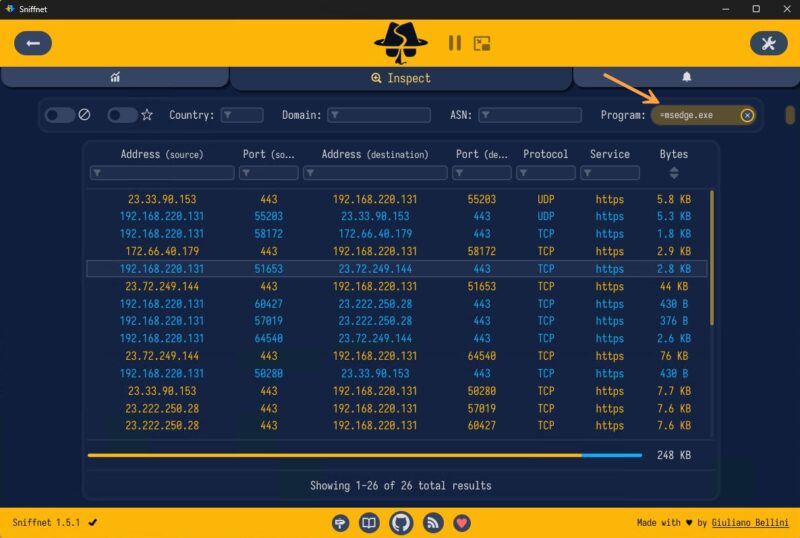
The Inspect tab shows all connections observed during the session, identified by their source address and port, their destination address and port, and the protocol. Each column in the table also has its own filter.
Filters work by partial matching by default, but a few operators make it more precise:
=: exact match (for example=svchost.exe).!: exclude results that contain the value.!=: exclude results that match the value exactly.
Everything works in real time, much like in Wireshark, except that here the information is pre-filled and all you have to do is click.
Connection details and latency
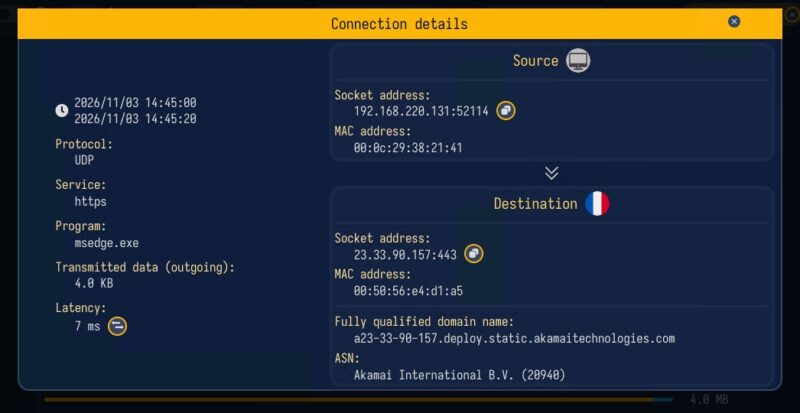
To learn more about a connection, click it. A Connection details window opens with additional information:
- Timestamps of the first and last observed packet.
- The protocol (TCP, UDP, ICMP, ARP...) and the associated service.
- The program behind the connection.
- The amount of data transferred.
- Source and destination, with the address and port (socket), MAC address, and ASN of the remote host for each.
In the example below, the connection was established by CefSharp.BrowserSubprocess.exe to a Cloudflare IP address (172.64.151.134) on port 443. A button also lets you measure the latency between the local machine and the remote host, that is, the round-trip time (RTT) in milliseconds, similar to a simple ping. Here, the latency is 9 ms.
Pausing the capture and using compact mode
Back in the overview, you can pause the display at any time using the button located in the application header. This is useful if you have spotted something interesting and want to analyze it without being flooded by new traffic as it arrives.
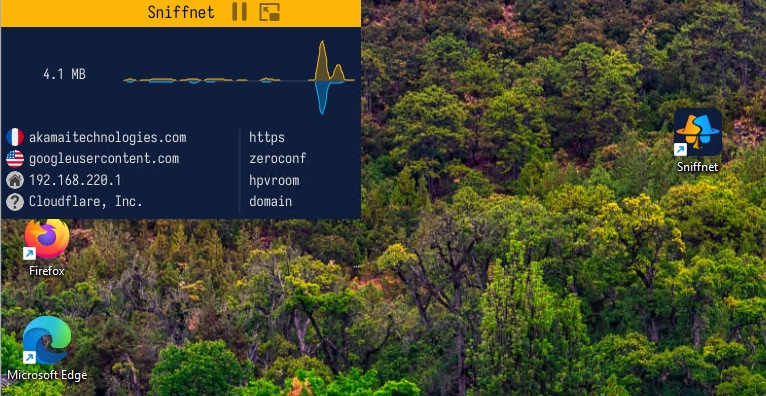
The button right next to it activates compact mode. Sniffnet then shrinks into a small window that you can place in a corner of the screen, like a widget. It displays the traffic graph along with the latest hosts and services observed, and notifications continue to arrive in this view.
Sniffnet capture options
Sniffnet offers additional features on its home page. To use them, you need to stop the current capture and start it again.
Exporting the capture to PCAP
The Export capture file option allows Sniffnet to generate a PCAP file during capture. You can customize the file name (sniffnet.pcap by default) and the destination folder (your home directory by default).
This PCAP file can then be opened in Wireshark, which natively reads this format. The idea is simple: you capture with Sniffnet, and if you want to go further in the analysis and dissect certain packets, you have the saved file as output. It can also be used with tcpdump or tshark.
Sniffnet exports to classic PCAP format, not PCAPng. If you need PCAPng, you can convert the file with editcap, which is installed with Wireshark (to go further with this tool, see our article on advanced PCAP file handling with editcap).
Filtering traffic with a BPF filter
The Filter traffic option lets you enter a BPF (Berkeley Packet Filter) filter. This is the same syntax as tcpdump and Wireshark capture filters, so if you are used to them, you will be in familiar territory. Be careful not to confuse this with Wireshark display filters, which are often used: here, the filter applies at capture level, and packets that do not match are not captured.
Here are a few examples.
| Need | BPF filter (Sniffnet, tcpdump) | Wireshark display filter |
|---|---|---|
| A specific host | host 192.168.1.10 | ip.addr == 192.168.1.10 |
| A TCP port | tcp port 443 | tcp.port == 443 |
| Exclude SSH | not port 22 | !(tcp.port == 22) |
Favorites for filtering the display
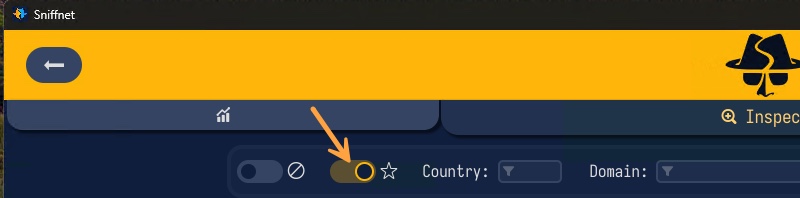
Instead of using a BPF filter, you can also click the small star in front of a host, service, or program in the overview to add it to your favorites. Then, in the Inspect tab, the Only show favorites option lets you display only the connections related to your favorites.
You then get an inspection list filtered according to everything you have marked as a favorite. This is another way to filter, this time with a display-filter approach: the capture continues to record all traffic, but you only display what interests you.
Sniffnet settings
Application settings are accessible via the gear icon in the top-right corner. In the General tab, you can notably change the interface language: French is available. You can also adjust the application zoom level.
The Style tab lets you change the application theme. Several dark and light themes are offered (A11y, Dracula, Gruvbox, etc.), and you can even create your own custom themes.
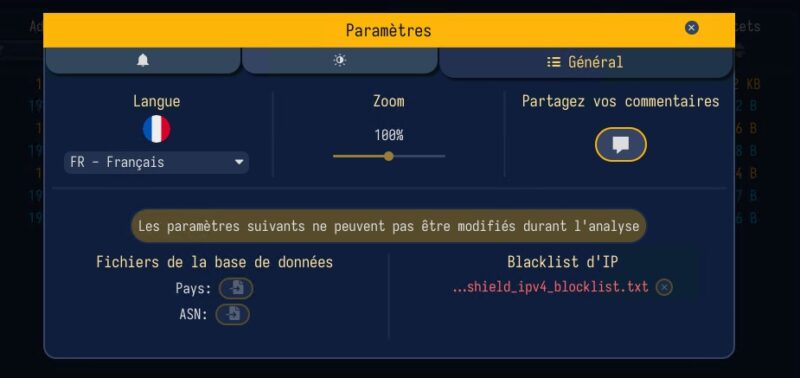
Still in the General tab, the Database files section lets you load your own MMDB files for geolocation (Country) and ASNs (ASN). This is not required: Sniffnet already includes the free version of the GeoLite2 databases from MaxMind. This option is useful if you want to update those databases without waiting for a new Sniffnet release, use a more accurate commercial database, or switch to another provider.
Detecting a suspicious connection with an IP blacklist
Importing an IP blacklist into Sniffnet
If you want to know whether your machine is communicating with malicious IP addresses, the IP blacklist feature is for you. A blacklist (or blocklist) is a list of IP addresses known for malicious behavior: spam, malware distribution, DDoS attacks, scans, and so on.
For my part, I use the IPv4 blocklist from the Data-Shield project, which I recommend. Originally designed for inbound filtering on firewalls and WAFs, it is available in two profiles: Standard, the recommended starting point with exceptions that limit unnecessary blocking, and Critical, which is stricter. I downloaded the TXT file for the standard list (prod_data-shield_ipv4_blocklist.txt) from the project’s GitHub repository.
Then, in Sniffnet settings, you simply import this file via the IP blacklist section. Sniffnet accepts any file format as long as it contains one IP address or CIDR range per line. Lines that do not start with a valid IP address or range are ignored, which lets you keep comments in the file.
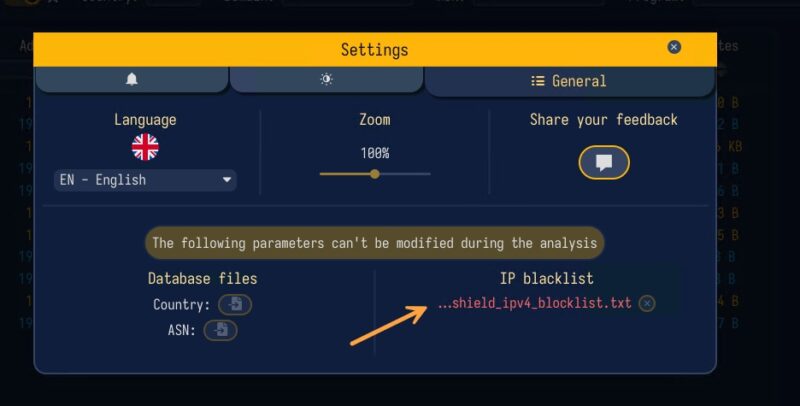
From now on, if Sniffnet sees a connection to an IP address present in this blacklist, it highlights it. You can also display only the relevant connections in the Inspect tab using the dedicated filter. This makes it easy to quickly see whether your machine is currently exchanging data with suspicious or malicious IP addresses.
Warning: Sniffnet does not block anything. It alerts you that traffic is being exchanged with a blacklisted IP address, but the connection does take place.
Enabling notifications
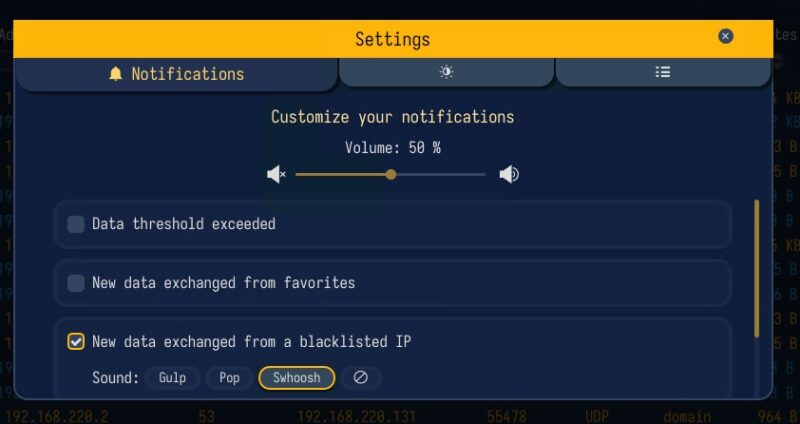
The Notifications tab in settings lets you be alerted when certain events occur. Notifications are disabled by default, and three types of events are available:
- Data threshold exceeded: traffic volume exceeds a per-second threshold, expressed in bits, bytes, or packets.
- New data exchanged from favorites: data is exchanged with one of your favorites.
- New data exchanged from a blacklisted IP: data is exchanged with an IP address from the blacklist.
For each event, you can choose the sound that will be played by the machine, whether it is Windows, Linux, or macOS. A Remote notifications option also allows notifications to be sent to a custom endpoint.
Sniffnet or Portmaster: what are the differences?
If you follow IT-Connect, you may be thinking of Portmaster, the open source application firewall that I recently introduced. It also lets you analyze a machine’s network connections, but the two tools do not serve the same purpose.
| Criterion | Sniffnet | Portmaster |
|---|---|---|
| Role | Passive network analyzer | Active application firewall |
| Connection blocking | No, alerts only | Yes, by application, domain, country, etc. |
| Platforms | Windows, macOS, Linux | Windows and Linux only |
| Capture export | Yes, in PCAP format | No |
| Filters | BPF at capture time | Portmaster-specific filtering rules |
| System impact | Low, does not modify network configuration | Higher (kernel driver, DNS support) |
| Model | Completely free | Free version and paid plans |
Portmaster is there to analyze traffic, but also to block suspicious connections or prevent certain applications from communicating over the network. Sniffnet, for now, is only a network analyzer: it is lighter on the machine and serves as a monitoring tool. In short, it is passive, whereas Portmaster is active. The two tools complement each other: Sniffnet for observation, Portmaster for blocking.
Sniffnet could, however, move closer to Portmaster in the future. The project roadmap, available from the footer of the official website, lists the features planned for upcoming versions:
- Version 1.6.x: service categorization, throughput display, extended view, IGMP support, VLAN header analysis, IPFIX collector for monitoring remote devices, display of packets lost by the network adapter, and more.
- Version 1.7.x: redesign of the Inspect page, storage and display of data history on the machine, a menu bar widget, launch at startup, and interactive charts.
- Later versions: firewall capabilities (on Windows, Linux, and macOS), traffic pattern recognition and detection, packet content inspection, a web interface, and a terminal-mode interface.
Conclusion
Sniffnet is an interesting tool to know for analyzing the network traffic of a machine without using Wireshark, especially if you are hesitant about using that tool. Above all, the developer had the good idea to include PCAP export, which makes it easy to bridge Sniffnet and Wireshark. Its main strength is accessibility: where Wireshark can impress with its depth of analysis, Sniffnet gives you a clear view of traffic in just a few clicks, with programs, countries, and ASNs already identified.
To go further:
- Wireshark and capture filters
- Reading and writing files with tcpdump
- Advanced PCAP file handling with editcap
- DNS exfiltration: understanding, detecting, and blocking a stealthy leakage channel