www.it-connect.fr


World Cup 2026: How Cloudflare Saw the Tournament Reshape Internet Traffic
What if the match that shook the Internet the most was neither the final nor a semifinal? That is one of the takeaways from Cloudflare’s analysis, which examined global HTTP traffic throughout the 2026 World Cup. Time zones, halftime, cooling breaks, streaming, and online betting: Cloudflare Radar data paints an unprecedented picture of how the planet connected, or disconnected, to the rhythm of the matches. Here’s what we can learn from it.
Time zones, the first factor driving traffic shifts
With a network spread across more than 330 points of presence and a footprint in more than 120 countries, Cloudflare is in a very strong position to measure the major movements of global Web traffic. That central position enables unique analysis and also explains the shockwave triggered whenever there is an outage (we still remember the global outage on November 18, 2025).
To make comparisons possible from one country to another, Cloudflare says it defined a baseline based on the median traffic from the previous four weeks, minute by minute. The deviation from that baseline is then expressed as a ratio in log₂: a score of zero means traffic is perfectly normal, a positive value indicates a spike (+1 corresponds to traffic doubling), and a negative value a drop (−1 corresponds to traffic being cut in half).
First observation, and not surprisingly: the most decisive factor is simply the local kickoff time. Matches played at night or very early in the morning (roughly midnight to 8 a.m.) trigger the biggest increases, with traffic sometimes more than doubling, at a time when very few users are normally online. By contrast, a match scheduled during the day barely moves the curve, since viewers would likely already be online anyway.
The example of Bosnia and Herzegovina is telling. According to Cloudflare, when the team plays at 2 a.m., viewers stay awake and traffic rises well above normal, even doubling. When it plays in the evening, the effect is reversed: traffic falls to about 70% of its usual level as users put down their screens to focus on the match.
The Brazil vs. Japan round-of-16 clash (Brazil won 2-1 on June 29, 2026) illustrates the same phenomenon across two different time zones. Twelve hours separate the two countries: traffic in Japan rose to around +1 (roughly double), with the match taking place in the middle of the night, while traffic in Brazil dropped below normal, around −0.4, because the game fell in the middle of the active daytime.
Argentina-Switzerland, the match that shook the network the most
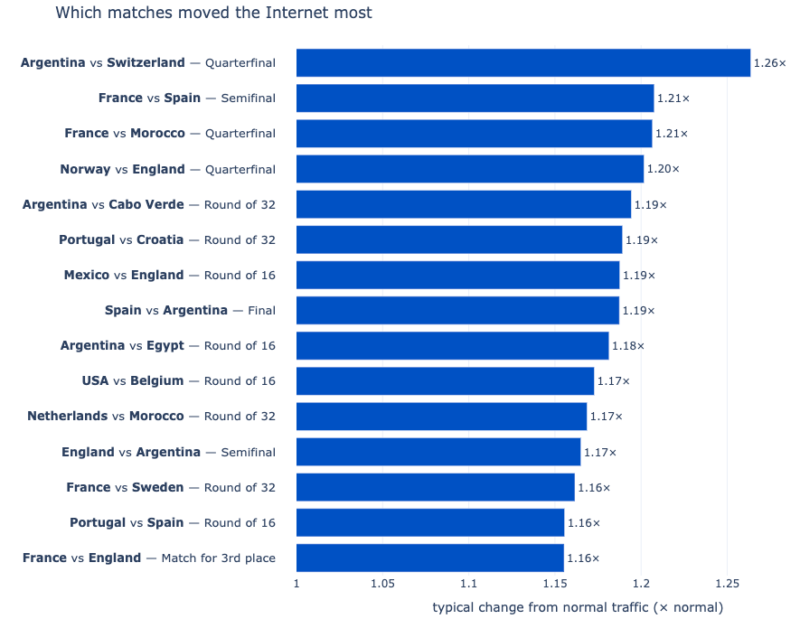
This is the question you are probably asking: which match shook the Internet the most? To build a ranking, Cloudflare says it selected, for each match, the two-hour window after kickoff, then measured the absolute deviation from normal traffic in each country with a reliable data set. Matches played simultaneously were excluded, since it was impossible to attribute a spike to one game or the other.
The top spot is occupied neither by the final nor by a semifinal. It was Argentina-Switzerland, a quarterfinal played on July 11 and won 3-1 by Argentina, that moved global traffic the most, with a factor of about 1.26. The match beats the France-Spain semifinal (factor of 1.21), while the rest of the top of the table includes quarterfinals, round-of-16 matches, and even round-of-32 fixtures.
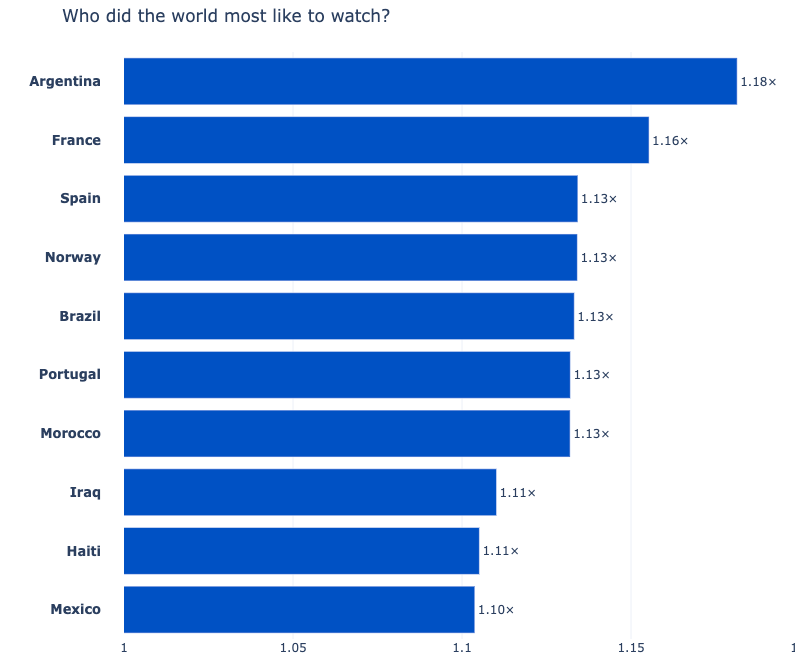
Looking more broadly at teams, which ones moved the Internet the most? Argentina still came out on top of one ranking, as it ranks number one in this one. Indeed, it led with a factor of 1.17, meaning that when it played, traffic in a typical country deviated by about 17% from its normal level, the strongest pull of the entire tournament. Some will say it was the Lionel Messi effect.
Right behind came France, Brazil, Portugal, Morocco, and Spain, as well as Norway, which had an excellent run. At the same time, and unsurprisingly again, Cloudflare observed an increase in traffic to sports betting sites.
Halftime, streaming, and cooling breaks: opposite behaviors depending on the country
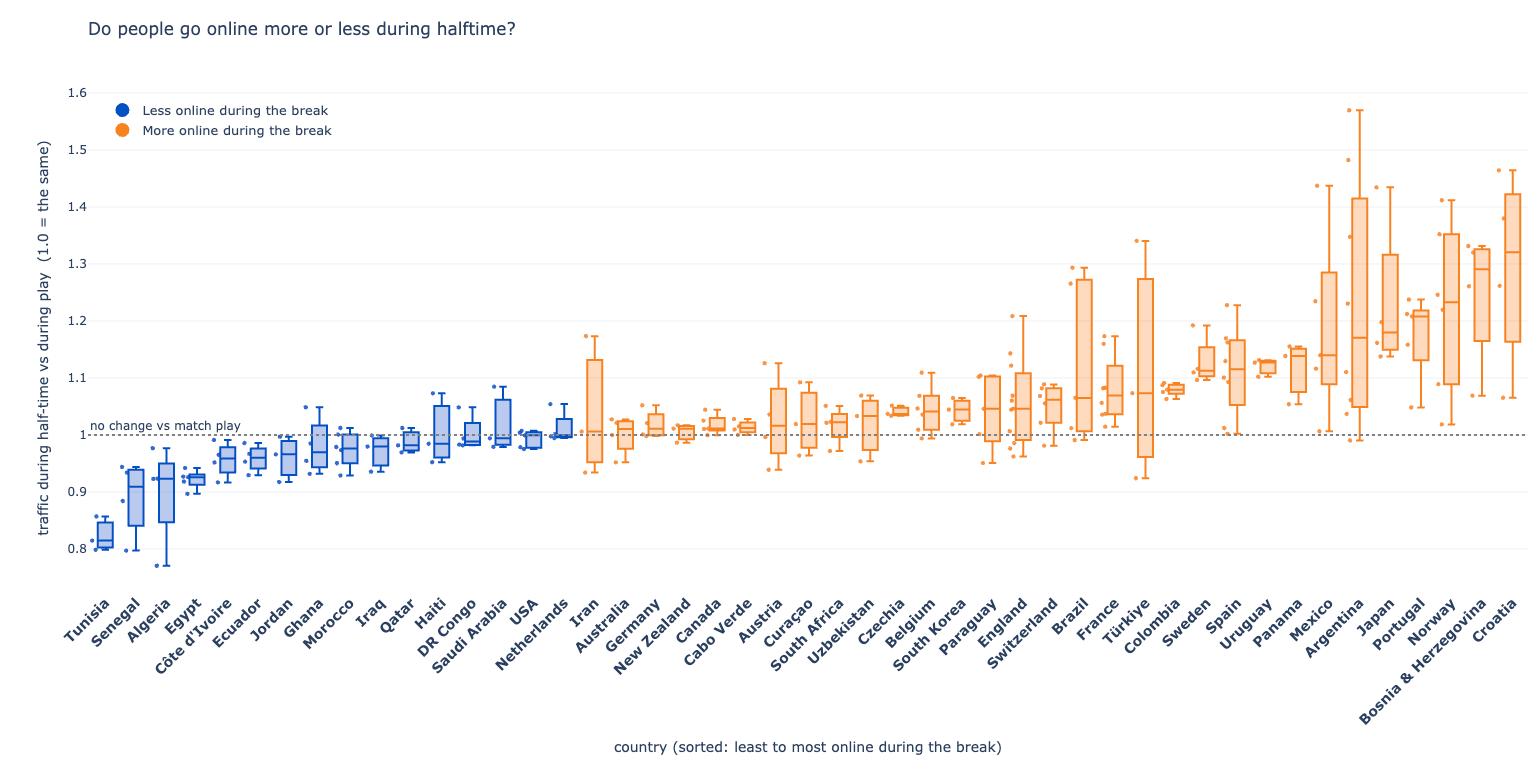
This may be the most subtle analysis. By grouping countries according to the shape of their traffic curve on match days, Cloudflare identifies three profiles. The most common one (44 countries and 101 matches) sees traffic rise during cooling breaks and halftime, as spectators grab their phones (with a likely urge to scroll TikTok, of course). A smaller second group (8 countries and 18 matches) does exactly the opposite: traffic drops during those same interruptions. The third profile is isolated and includes only Iran’s three matches, whose baseline data are distorted by the internet shutdowns observed in that country in 2026.
The same match can therefore produce two opposite behaviors. During Algeria-Austria in the group stage, traffic in Austria increased at halftime, while traffic in Algeria declined. The explanation appears to be streaming.
For the second group (Algeria, Tunisia, Jordan, Egypt, and DR Congo), Cloudflare broke down traffic by MIME type, those labels that tell the browser the nature of a file (HTML page, JPEG image, MP4 video stream, etc.). Result: in these countries, most of the increase during the match comes from multimedia and streaming services. It makes sense: you do not stop a stream for a three-minute cooling break, but a 15-minute halftime is long enough to close the app and walk away.
The contrast is also visible at halftime. Most countries see traffic rise as soon as play stops, with Croatia and Bosnia and Herzegovina leading the way, while a minority, including Tunisia and Algeria, disconnect. Even cooling breaks, which last only about three minutes, are enough to make traffic climb in most countries before dropping again once play resumes.
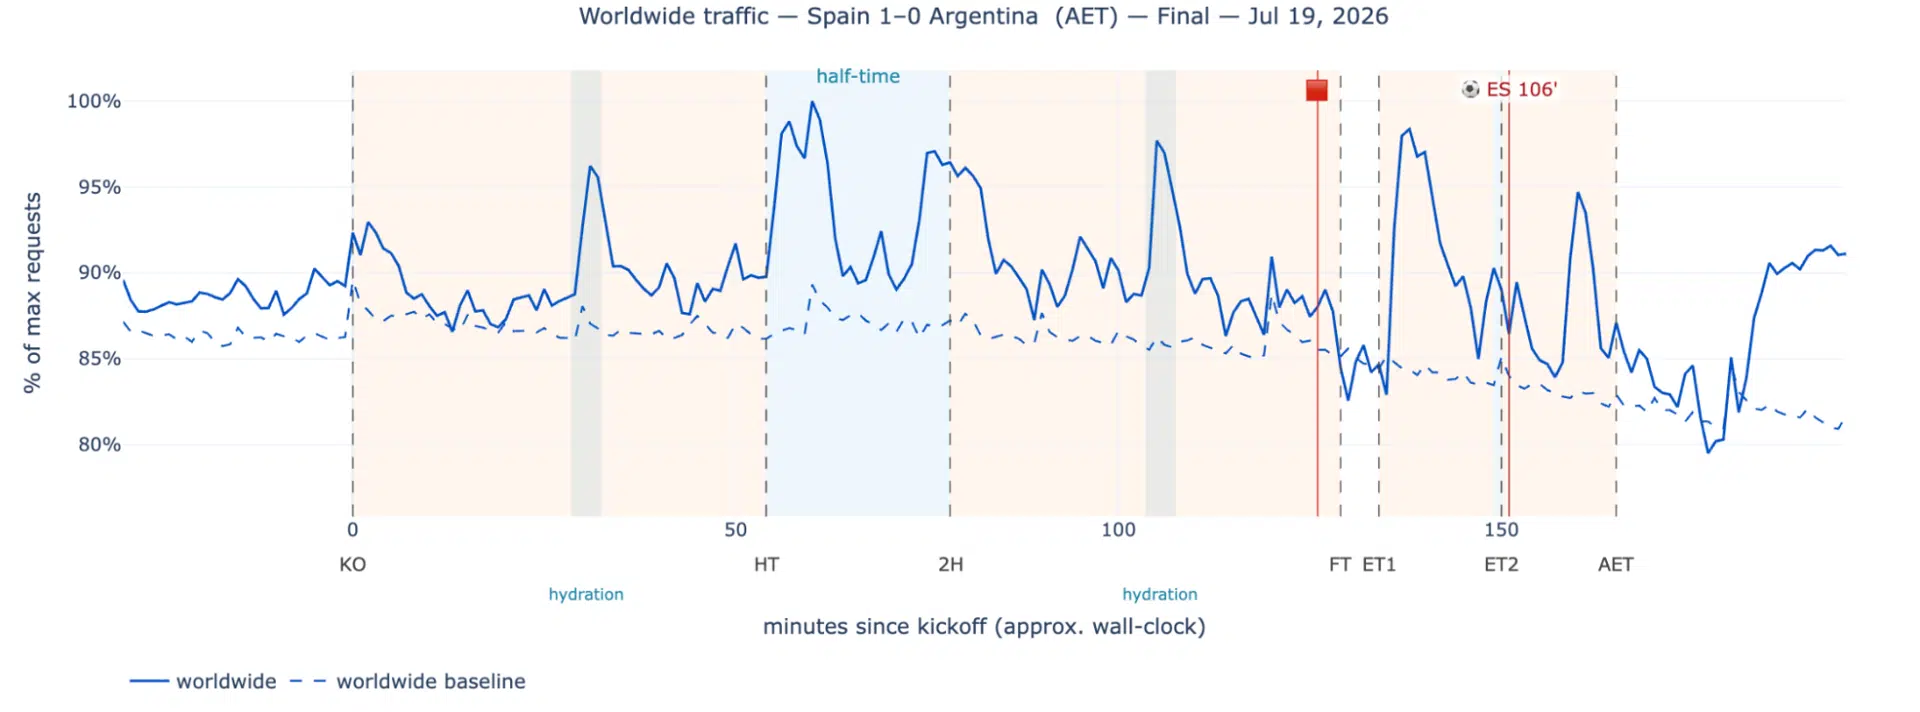
And what about the Spain-Argentina final in all this? During the match, traffic volume in Argentina and Spain rose by up to 20% compared with an equivalent period, and the curve closely followed the key moments of the game, from kickoff to the final whistle. A similar pattern was observed during the third-place match between France and England.
Find the full report on Cloudflare’s website.