www.it-connect.fr

Windows Forensics, Part 12: Analyzing SRUM
SRUM is a little-known artifact, yet one of the richest in Windows for digital investigations. It can be used to reconstruct application execution history, as well as resource consumption, network activity, and battery usage.
Building on the artifacts related to user activity, in this twelfth part of our Windows forensics series we will focus on the SRUM database: where it is located, how to acquire it with KAPE, and how to analyze it with Eric Zimmerman's SrumECmd. If you missed the previous episodes, you can read part 9 on the Recycle Bin and part 10 on the MFT.
What Is SRUM?
The System Resource Usage Monitor (SRUM) is a mechanism introduced by Microsoft with Windows 8 and present on all recent versions of Windows, including Windows 10, Windows 11, and Windows Server.
Its role is to periodically record application activity along with various metrics related to resource usage. This information is primarily used by Windows to generate the usage statistics visible in Task Manager (the App history tab) or in battery usage settings.
For a forensic analyst, SRUM is a real treasure trove of information. It can provide details about:
- Executed applications
- Associated users
- Network activity
- CPU and memory consumption
- Battery usage on laptops
- Various timestamps that help rebuild an event timeline.
Where Is SRUM Located?
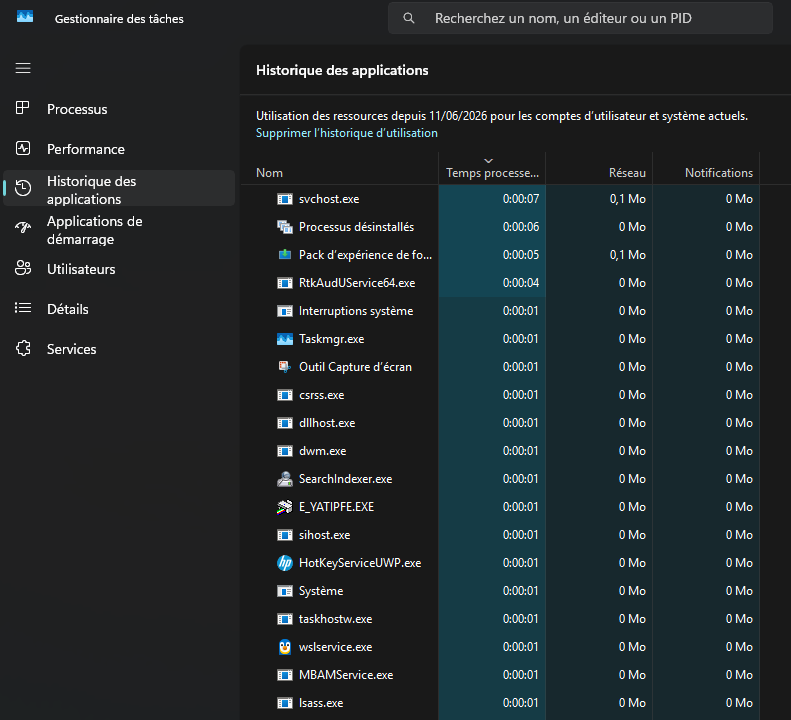
Windows exposes some SRUM information through different graphical interfaces. In particular, some statistics can be found in Task Manager, under the App history tab.
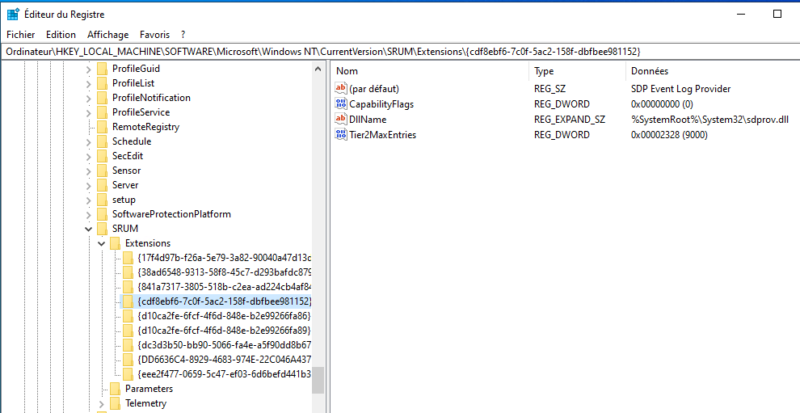
The extensions used by the database are also referenced in the following registry key:
HKLM\SOFTWARE\Microsoft\Windows NT\CurrentVersion\SRUM\ExtensionHowever, this key does not contain activity data, only information describing the various tables used by SRUM.
Each subkey corresponds to an extension identified by a GUID, together with its associated DLL (for example appsruprov.dll for application usage, nduprov.dll for network usage, and so on). This key does not contain activity history: it describes the tables present in the database and acts as a buffer area before data is periodically written to the database file.
The actual database is stored in the following directory:
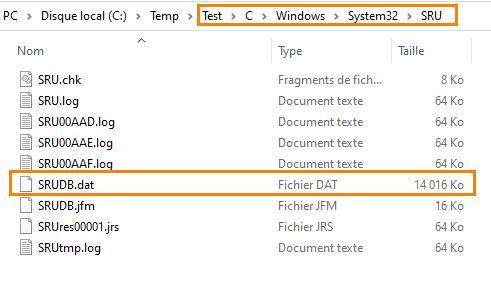
C:\Windows\System32\sru\The main file is this one:
SRUDB.datThis is an ESE (Extensible Storage Engine) database, also known as Jet Blue, the same engine used by several Windows components such as Active Directory or Windows Search.
Warning: because the file is constantly in use by the system (through the Diagnostic Policy Service), it is locked and usually cannot be copied directly from a live system. During a forensic acquisition, it must therefore be obtained from a VSS copy, an offline disk, a system image, or an acquisition tool such as KAPE.
Acquiring the SRUM Database with KAPE
As with the MFT, the SRUM database is protected and continuously used by the system. We will therefore acquire it using KAPE.
Launch gkape.exe, select the source drive and the destination folder, then search for the SRUM Target to collect the SRUDB.dat file.
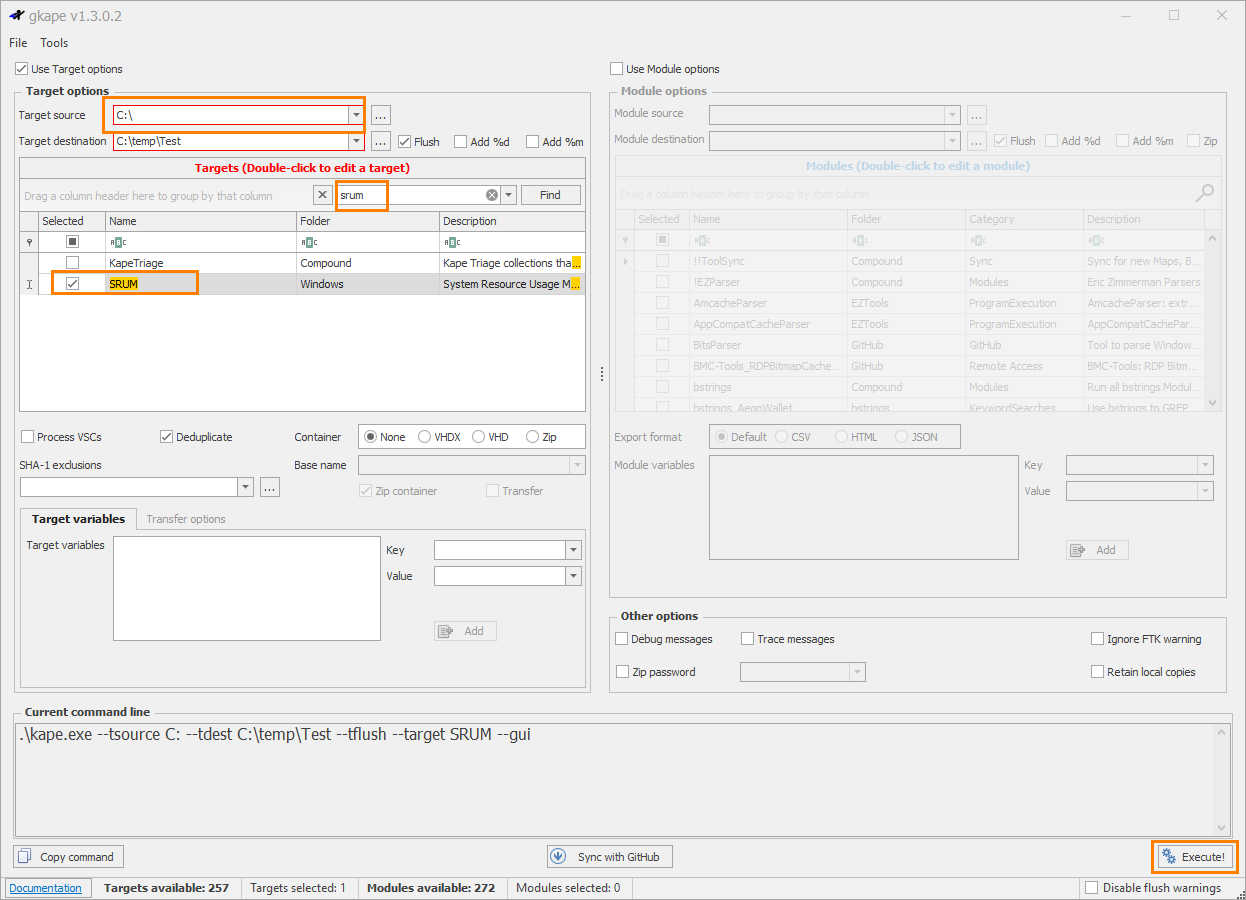
Once the acquisition is complete, navigate to the output directory to find the SRUDB.dat database.
Analyzing the SRUM Database with SrumECmd
We will now analyze this file using SrumECmd, a command-line tool developed by Eric Zimmerman, who is also behind several other tools used in this series (PECmd, LECmd, SBECmd, RBCmd). It is open source and free.
- Official website (Eric Zimmerman's tool suite): ericzimmerman.github.io
- GitHub repository: github.com/EricZimmerman/Srum
Download the latest version of the tool, then extract all of its contents into a folder. As with the other tools in the suite, make sure the DLLs were extracted properly.

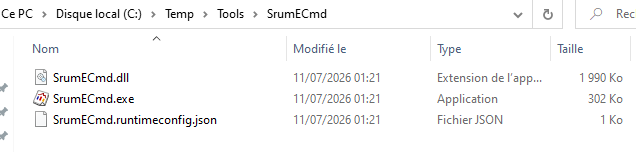
Next, open a Command Prompt, change to the tool directory, and run the following command:
SrumECmd.exe -f "C:\chemin_de_la_base\SRUDB.dat" --csv "C:\chemin_de_sortie"
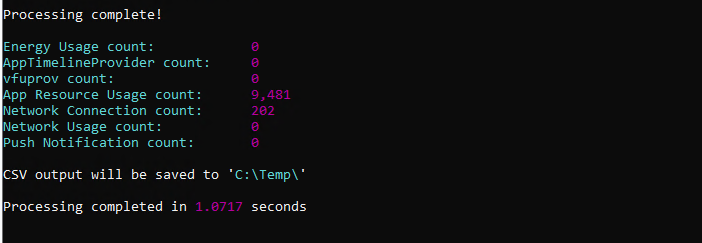
The result is shown below. For reference, here are some details about the options used in the previous command:
-f: theSRUDB.datfile to analyze--csv: the folder where the CSV reports will be saved (the path must be enclosed in double quotes)
Analyzing the Results
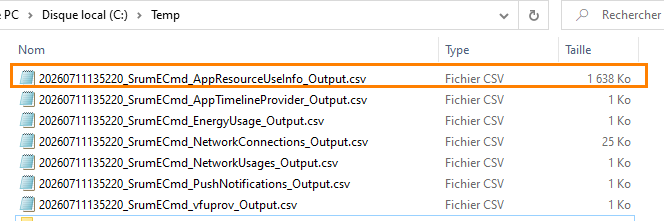
At the end of the analysis, SrumECmd generates several CSV files corresponding to the different categories of information contained in the database.
Notably, we find:
AppResourceUseInfo, which contains data related to application usageNetworkConnections, which provides information about connections and network interfacesNetworkUsages, which shows the volume of data sent and received- Files related to power consumption and battery usage.
It is recommended to review all of these reports, since each one provides a different view of system activity.
Application Usage
In our example, we will mainly focus on the AppResourceUseInfo file. This report contains a wealth of information, including:
- The record timestamp
- The application name and path
- The user identity, represented by the SID (and the name if the
SOFTWAREhive was provided) - Foreground and background usage time
- Processor consumption
- Amounts of data read or written
- Various details related to resource usage
In our example, as with the MFT, we once again find an activity trace associated with SharpHound.exe.
The presence of the SID also makes it possible to identify the user account associated with this activity, which helps tie an application to a user.

Analyzing Network Activity
The NetworkUsages file is an interesting element: it makes it possible to identify network usage associated with applications and users. It contains in particular:
- The application involved
- The user's SID
- The network interface or profile used
- The amount of data sent
- The amount of data received
- The record timestamp
This information can help identify abnormal network activity, such as a large amount of data being sent by an unusual application, which is typical of exfiltration.
In our example, we can observe the network activity of several applications, such as Adobe and RDC-On, as well as the type of account involved and its SID. Using filters, it is possible to exclude system accounts to more easily identify unusual network activity.
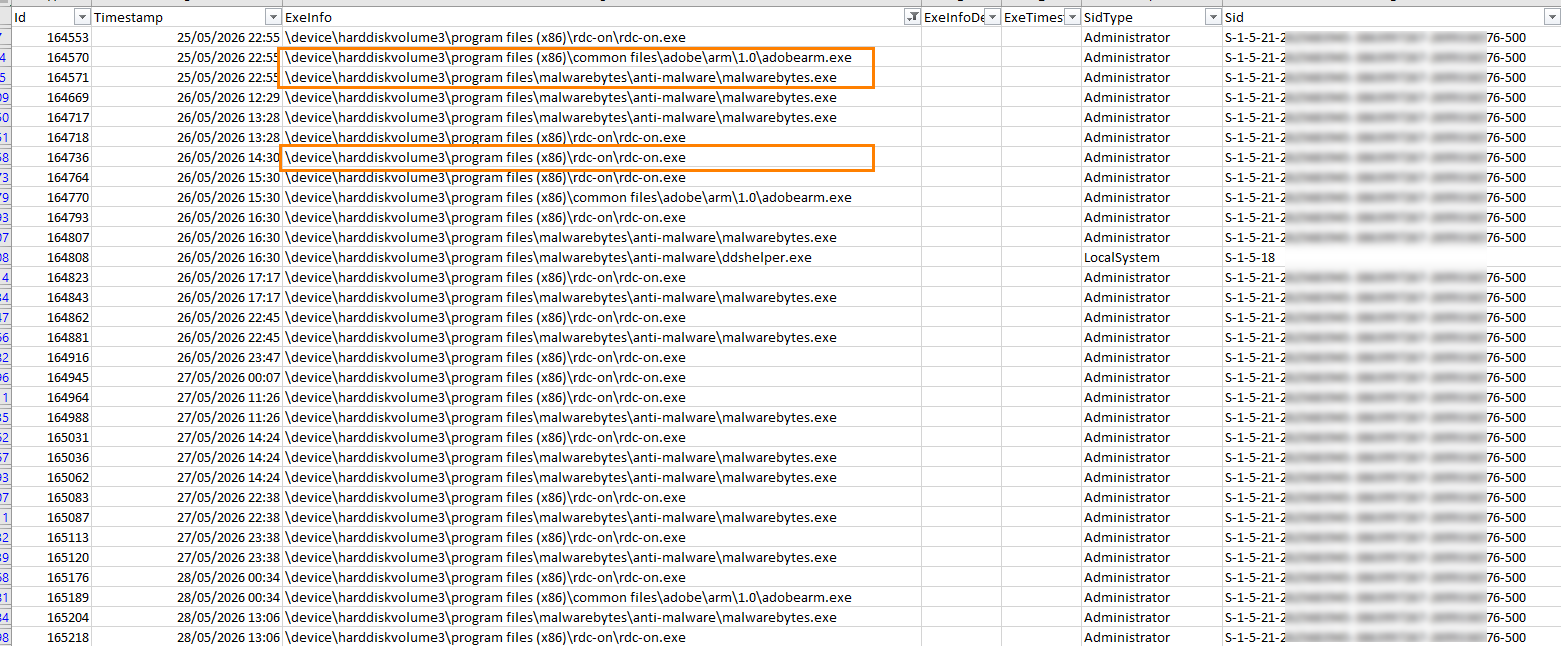
The CSV file also makes it possible to group results by application and calculate the total volume of sent and received data. This can help detect abnormal network consumption, but it does not directly reveal the IP addresses or domains contacted.
Conclusion
SRUM is a particularly rich artifact for reconstructing the historical activity of a Windows system. Thanks to the SRUDB.dat database, it is possible to link application usage to a user, a time period, and different system or network consumption data, including for executables that have since been deleted.
In our example, the analysis made it possible to recover activity associated with SharpHound and determine the identity of the user involved. This information is an important clue, but it should be correlated with other artifacts (Prefetch, Amcache, BAM, MFT) to confirm that the tool was executed and to accurately reconstruct the event timeline.