www.it-connect.fr

GoAccess: Real-Time Web Server Log Analysis Made Easy
The log files generated by your web server contain all the traffic statistics for your website, but you still need a way to read them. Whether you host a personal blog, self-hosted services, or a web server with an enterprise portal, the access.log file accumulates hundreds or even thousands of lines every day that no one ever looks at. GoAccess turns this raw stream into a readable dashboard in just a few seconds, with no database required.
Want to learn more? In this article, I’ll introduce GoAccess and show you how to install it on a Debian machine (or Ubuntu). We’ll see how to use it from the command line, all the way through generating an HTML report that presents the logs in a clean and readable way.
GoAccess at a glance
To analyze a web server’s logs with GoAccess, install the package, then run the following command: goaccess /var/log/apache2/access.log --log-format=COMBINED. Just adapt the path to the log file. The dashboard appears directly in the terminal. Later, add -o rapport.html to generate an HTML report viewable in a browser.
Note: GoAccess works only from server logs. No JavaScript script or cookie is dropped on your visitors’ devices.
What is GoAccess?
GoAccess is a web log analyzer developed since 2010 by Gerardo Orellana. Written in C, it relies on the ncurses library and is a particularly lightweight and efficient open source tool. It is published under the MIT license and is completely free (there is no commercial edition).
Its principle is simple: it reads a log file, extracts the useful fields, then presents the statistics in the form of a dashboard with multiple sections. You’ll find unique visitors by date, the most requested pages, 404 errors, hosts, operating systems, browsers, the most common source IP addresses, and HTTP status codes.
The advantage of this tool is that it recognizes many log formats, which allows it to support the most popular web servers. These include Combined and Common (Apache, Nginx), W3C (IIS), Squid, Caddy, Traefik, Amazon CloudFront, S3, and even Google Cloud Storage. And if that’s not enough, you can define a custom format from a configuration file.
GoAccess can be installed on different operating systems, both Linux and Windows. On Linux, native packages are available, while on Windows you’ll need to use WSL or run a Docker container.
To learn more about GoAccess, keep reading this article and check out these two official resources:
- Official website: goaccess.io
- GitHub repository: allinurl/goaccess
Installing GoAccess on Debian or Ubuntu
The package available in Debian’s official repositories works, but it is very likely not the latest version. I therefore recommend adding the project’s repository, which provides the latest stable release.
# Récupération et conversion de la clé de signature du dépôt
wget -O - https://deb.goaccess.io/gnugpg.key | gpg --dearmor | sudo tee /usr/share/keyrings/goaccess.gpg >/dev/null

# Déclaration du dépôt, associé à la clé précédente
echo "deb [signed-by=/usr/share/keyrings/goaccess.gpg arch=$(dpkg --print-architecture)] https://deb.goaccess.io/ $(lsb_release -cs) main" | sudo tee /etc/apt/sources.list.d/goaccess.list

# Installation
sudo apt update
sudo apt install goaccess
Next, verify that the installation completed successfully:
# Affiche la version
goaccess --version
Analyzing an access.log file in the terminal
Most likely, you installed GoAccess on your server to analyze your access logs, usually stored in the access.log file. To analyze logs properly, it needs to know the log format. If you customized the format, it is indicated in the site’s Virtual Host file. Otherwise, it is probably in the default Combined format.
Here is how to start an analysis on Apache2’s access.log file:
sudo goaccess /var/log/apache2/access.log --log-format=COMBINED -aBreakdown of the elements used:
--log-format=COMBINEDcorresponds to the default format of Apache and Nginx. For a multi-site server, useVCOMBINED, which includes the virtual host name.-aenables the list of user agents by host, which is useful for identifying an overly persistent bot.
To push GoAccess for the purposes of writing this article, I ran it on an aggregated Apache log weighing 24.4 GB and covering seven months of activity on the IT-Connect web service, representing more than 99 million requests. Processing the entire file took about 38 minutes, without a database and while consuming very little RAM. After this analysis, GoAccess reported 11.1 million unique visitors, 130,383 failed requests, and 2.37 TB of transferred data.
It is important to understand that GoAccess works on a raw log file. This log file contains everything: human requests, bots, and more. So there is plenty of noise, or at least all the traffic that reached the website: not everything corresponds to real visits. In fact, analysis of this data set shows that /wp-login.php accounts for nearly 2.9 million requests: these are automated login attempts against WordPress’s default login interface. Bots account for nearly 17% of hits.
Once inside the GoAccess interface, a few keys let you navigate: TAB moves from one panel to another, ENTRÉE expands the selected panel, / starts a search (regular expressions are supported), and q quits the application. Be careful: when you exit, GoAccess removes its traces (persistence is disabled by default). As a result, rerunning the same analysis requires waiting again (on a daily log file, this will only take a few seconds).
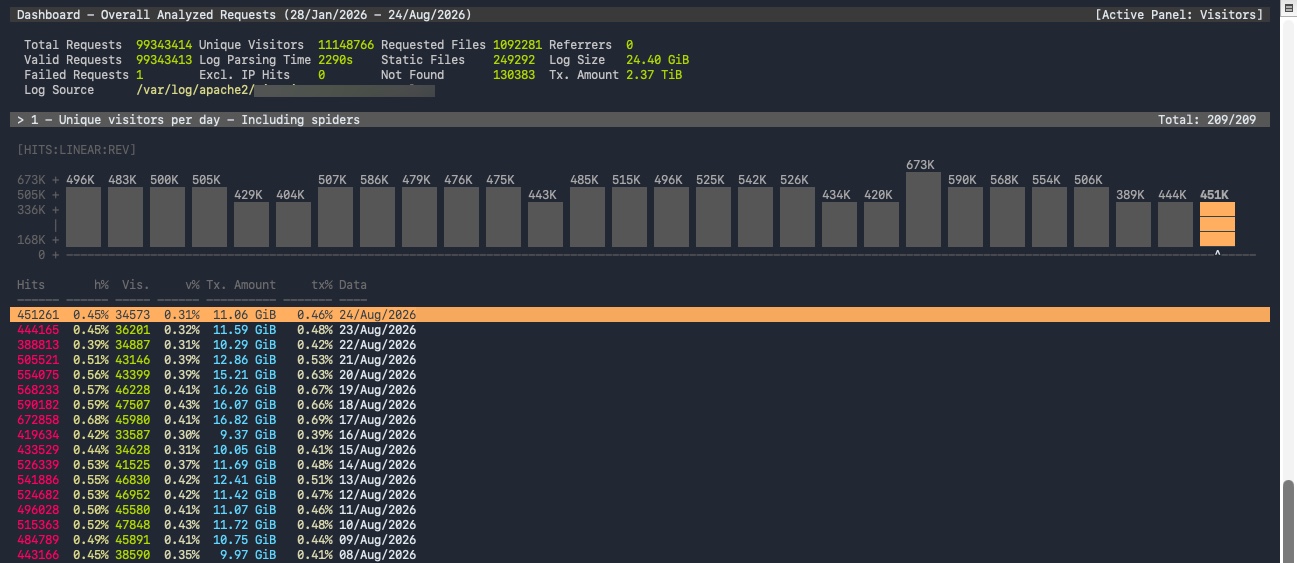
You can analyze several files at once, which is essential after log rotation. That is even the logical behavior, since ideally the web server performs a log rotation. In the example above, I pushed it to see whether the tool would behave well with large files.
If you want to analyze the current log and the previous archive (.1), use this command:
sudo goaccess /var/log/apache2/access.log /var/log/apache2/access.log.1 --log-format=COMBINEDAdapting GoAccess to your log format
If your server uses a custom log_format, the predefined formats will not be suitable. You then need to describe your log format using specifiers. In that case, you should rely in particular on: %h (client IP address), %d (date), %t (time), %r (request line), %s (status code), %b (response size), %R (referer), %u (user agent), and %^ (field to ignore).
Three fields are mandatory: %h, %d, and %r. If we declare a custom format matching the Combined format, it would look like this:
# Format de date et d'heure, puis structure de la ligne
date-format %d/%b/%Y
time-format %H:%M:%S
log-format %h %^[%d:%t %^] "%r" %s %b "%R" "%u"
You may be asking: where do you put this? You can place it in the global configuration file, whose path can be obtained with goaccess --dcf. In principle, it will be this file:
/etc/goaccess/goaccess.confIf you browse through this file, you’ll also see that it contains many examples of log formats for various services. It also includes GoAccess’s general options. Among the available options, you can configure the following:
agent-list true: equivalent to the-aoption, it displays the list of user agents associated with each host when you expand the visitors panel.ignore-crawlers true: excludes recognized bots from the statistics, preventing them from inflating the unique visitor count.anonymize-ip true: masks the end of client IP addresses before displaying them, the last octet for IPv4 and part of the bits for IPv6.persist true: saves the analyzed data to disk at the end of processing instead of losing it when the application closes (which I mentioned earlier).restore true: reloads previously saved data at startup, making it possible to accumulate history over successive runs.db-path /var/lib/goaccess/: specifies the storage directory for this data, with/tmpas the default value, which does not survive a reboot.
As part of writing this tutorial, I installed GoAccess on the server where I deploy the Docker containers for my demos. There is a Traefik reverse proxy that keeps an access.log file. It centralizes the requests sent to all exposed services.
If your Traefik logs are in CLF format, you can use this syntax directly:
sudo goaccess /opt/docker-compose/traefik/logs/access.log --log-format=TRAEFIKCLF -aBut if, like me, your logs are in JSON format, then you’re out of luck. Indeed, I did set format: json in my Traefik configuration. That’s not a problem, though; it gives me a chance to practice declaring a custom log format.
To parse Traefik logs in JSON format, here is the syntax I used :
datetime-format %Y-%m-%dT%H:%M:%S
log-format {"ClientHost":"%h","RequestMethod":"%m","RequestPath":"%U","RequestProtocol":"%H","DownstreamStatus":"%s","DownstreamContentSize":"%b","request_Referer":"%R","request_User-Agent":"%u","RequestHost":"%v","Duration":"%n","StartLocal":"%x.%^"}
Because the change is made directly in GoAccess’s global configuration file, it will always be used automatically (otherwise create a separate file and call it with the -p /chemin/vers/traefik.conf option).
Generating a static or real-time HTML report
Terminal mode is fine for a quick inspection over SSH. To share or keep an analysis, the standalone HTML report is more appropriate. This is a good opportunity to test the previous syntax on Traefik logs and produce an HTML report. The command looks like this:
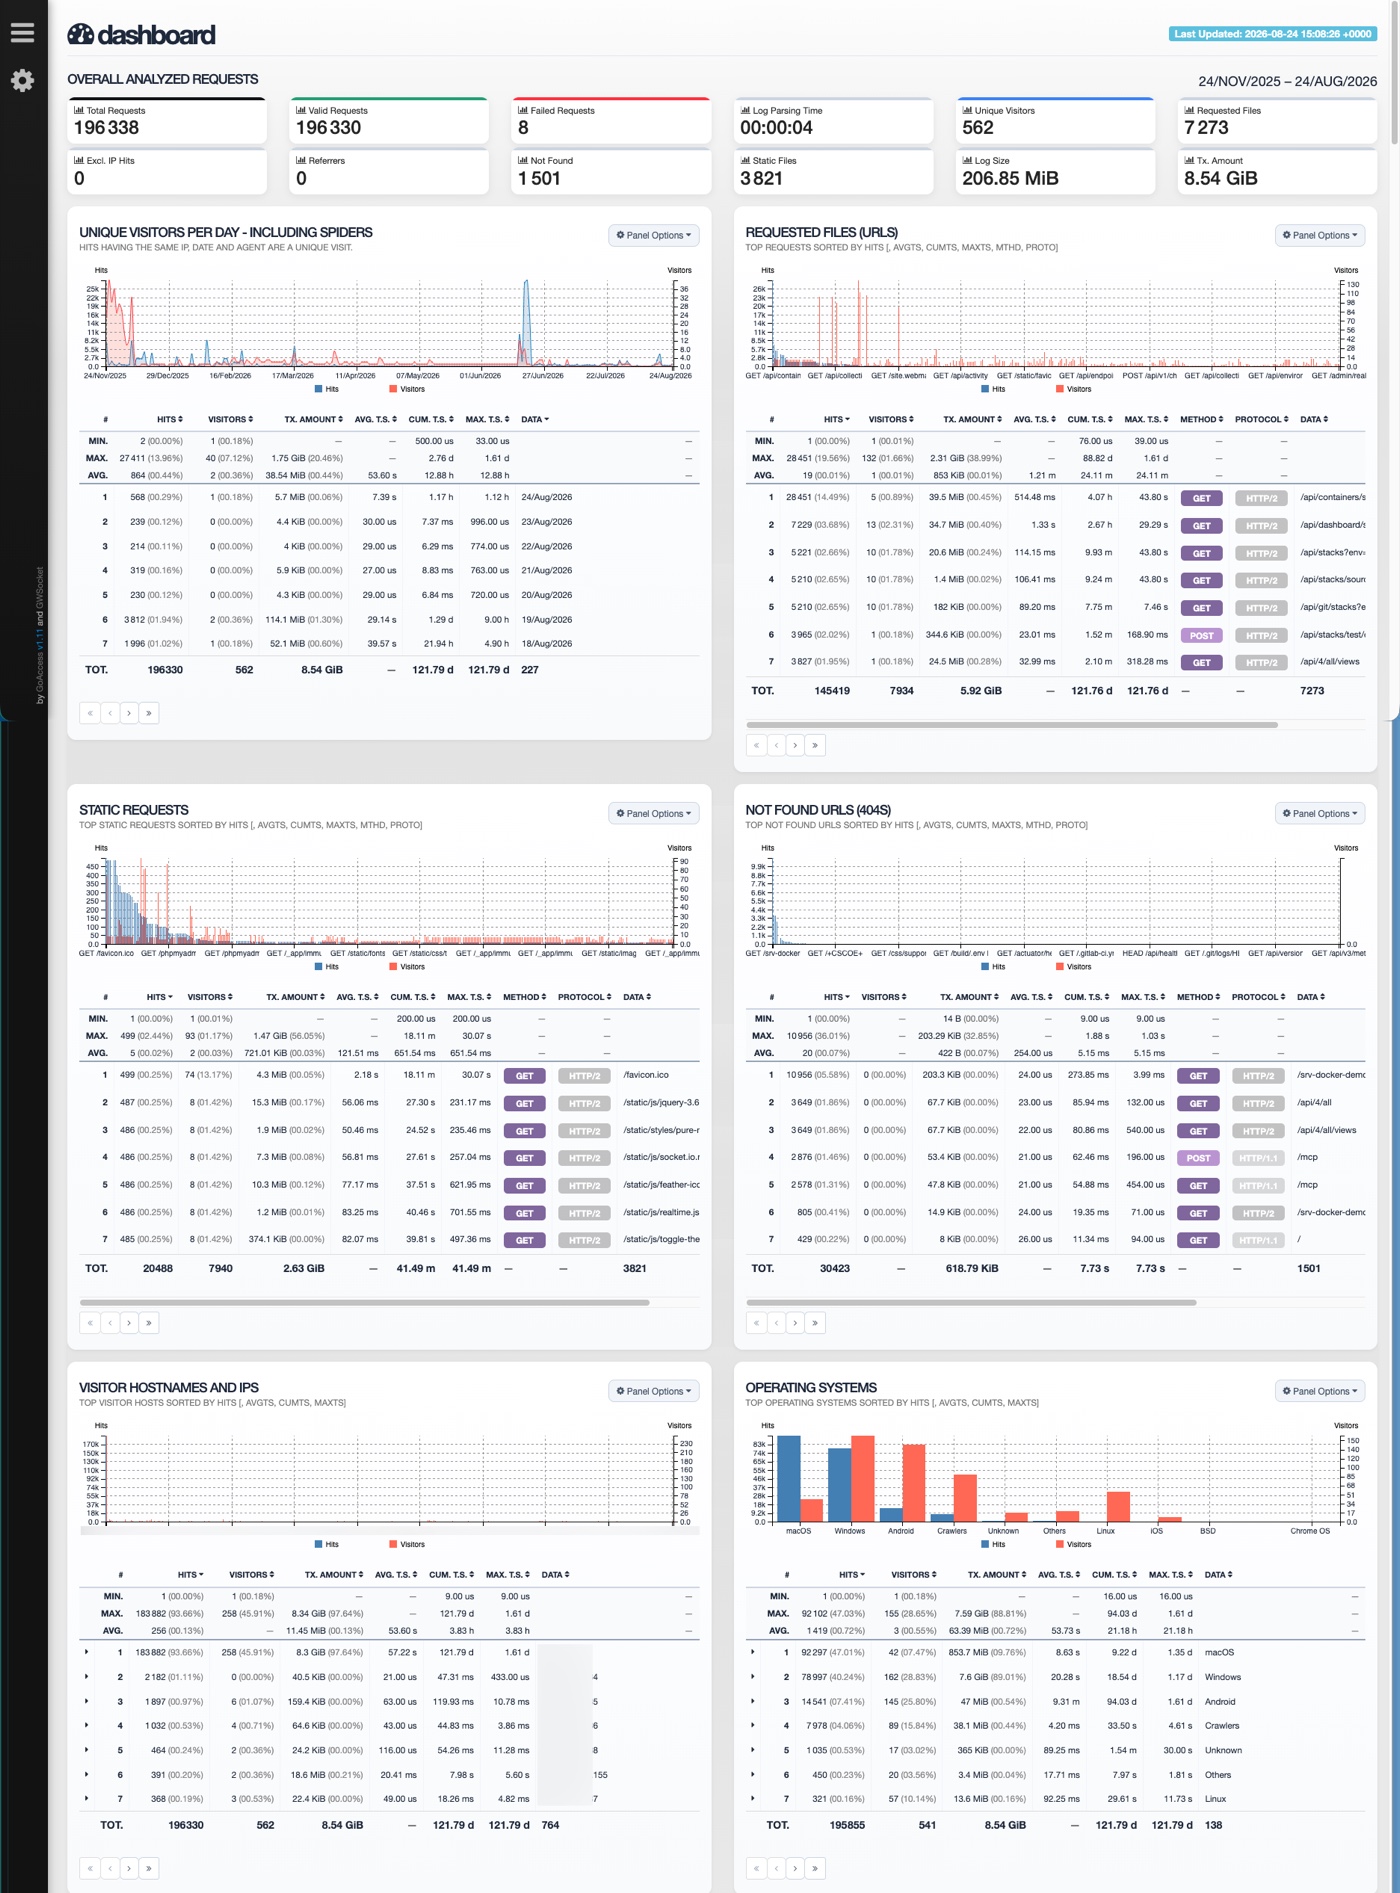
sudo goaccess /opt/docker-compose/traefik/logs/traefik.log -a -o /tmp/rapport.htmlAll that remains is to download the HTML file and view it whenever you want. The report is well designed, with sections and graphs. Below is a partial example from the Traefik log file. Nice, right?
Analyzing Traefik logs with GoAccess and Docker Compose
Here is a concrete scenario that I set up in my lab. The goal: analyze the access logs of a Traefik reverse proxy and publish the report in real time on goaccess.it-connectlab.fr, all in containers. Because yes, GoAccess can also keep the HTML report continuously updated (refreshed every 1 second) thanks to an integrated WebSocket server, which listens by default on port 7890.
In practice, GoAccess does not serve the HTML page, it only exposes its WebSocket server. You therefore need a web server alongside it to distribute the file. We will have two services, and only one domain name thanks to path-prefix routing.
Before we begin, a reminder: Traefik does not write any access logs by default. Make sure to configure the reverse proxy so that access logs are generated.
Project structure
The containerized GoAccess instance will be organized like this:
/opt/docker-compose/goaccess/
├── docker-compose.yml
├── .env
├── goaccess.conf
├── goaccess-data/        # rapport HTML généré
└── goaccess-db/          # base persistante
Create the directory structure:
sudo mkdir -p /opt/docker-compose/goaccess/{goaccess-data,goaccess-db}
cd /opt/docker-compose/goaccess
From here, let’s move on to preparing the different files.
The .env file
Create the file with the environment variables by adding this content:
# Domaine où est accessible le rapport
GOACCESS_DOMAIN=goaccess.it-connectlab.fr

# Emplacement des journaux Traefik sur l'hôte
TRAEFIK_LOGS=/opt/docker-compose/traefik/logs
The docker-compose.yml file
Create the docker-compose.yml file at the root of the project and insert the code below.
services:
  goaccess:
    image: allinurl/goaccess:latest
    container_name: goaccess
    restart: unless-stopped
    command:
      - --no-global-config
      - --config-file=/srv/config/goaccess.conf
    volumes:
      # Journaux Traefik montés en lecture seule
      - ${TRAEFIK_LOGS}:/srv/logs:ro
      - ./goaccess.conf:/srv/config/goaccess.conf:ro
      - ./goaccess-data:/srv/report
      - ./goaccess-db:/srv/db
    read_only: true
    security_opt:
      - no-new-privileges:true
    tmpfs:
      - /tmp
    networks:
      - frontend
    labels:
      - "traefik.enable=true"
      - "traefik.http.routers.goaccess-ws.rule=Host(`${GOACCESS_DOMAIN}`) && PathPrefix(`/ws`)"
      - "traefik.http.routers.goaccess-ws.entrypoints=websecure"
      - "traefik.http.routers.goaccess-ws.priority=100"
      - "traefik.http.routers.goaccess-ws.tls=true"
      - "traefik.http.routers.goaccess-ws.tls.certresolver=ovhcloud"
      - "traefik.http.services.goaccess-ws.loadbalancer.server.port=7890"

  goaccess-web:
    image: nginx:alpine
    container_name: goaccess-web
    restart: unless-stopped
    depends_on:
      - goaccess
    volumes:
      # Le rapport produit par GoAccess, servi en lecture seule
      - ./goaccess-data:/usr/share/nginx/html:ro
    read_only: true
    security_opt:
      - no-new-privileges:true
    tmpfs:
      - /tmp
      - /var/cache/nginx
      - /var/run
    networks:
      - frontend
    labels:
      - "traefik.enable=true"
      - "traefik.http.routers.goaccess.rule=Host(`${GOACCESS_DOMAIN}`)"
      - "traefik.http.routers.goaccess.entrypoints=websecure"
      - "traefik.http.routers.goaccess.tls=true"
      - "traefik.http.routers.goaccess.tls.certresolver=ovhcloud"
      - "traefik.http.services.goaccess.loadbalancer.server.port=80"
The frontend network is the external Docker network shared with Traefik, to be declared at the end of the file (add it after the code shown above).
networks:
  frontend:
    external: true
This Docker Compose file declares two services, one with the main GoAccess image and the other with a minimalist Nginx web server used to publish the GoAccess HTML report. This means it will be accessible at the address declared in the .env file, namely here: https://goaccess.it-connectlab.fr.
Also, if you read the Docker Compose file, you’ll see that two Traefik routers coexist on the same domain. In practice, Traefik sorts rules by length, and the one with the PathPrefix naturally takes precedence, while the priority directive makes the intent explicit. Note that no port is published on the host: Traefik reaches port 7890 over the internal network, which avoids exposing the WebSocket directly.
The goaccess.conf file
There is one last file to prepare: the one containing all of GoAccess’s configuration. This is a custom file capable of reading Traefik logs in JSON format, and it also adjusts GoAccess’s behavior. It reuses configuration options mentioned earlier.
# Format des journaux d'accès Traefik en JSON
datetime-format %Y-%m-%dT%H:%M:%S
log-format {"ClientHost":"%h","RequestMethod":"%m","RequestPath":"%U","RequestProtocol":"%H","DownstreamStatus":"%s","DownstreamContentSize":"%b","request_Referer":"%R","request_User-Agent":"%u","RequestHost":"%v","Duration":"%n","StartLocal":"%x.%^"}

# Entrée et sortie
log-file /srv/logs/access.log
output /srv/report/index.html

# Rapport temps réel derrière le reverse proxy
real-time-html true
ws-url wss://goaccess.it-connectlab.fr:443/ws
origin https://goaccess.it-connectlab.fr
addr 0.0.0.0
port 7890

# Options d'analyse
agent-list true
ignore-crawlers true
anonymize-ip true
no-query-string true

# Persistance de l'historique
persist true
db-path /srv/db/

# À décommenter après le premier démarrage (donc après le premier Docker Compose up)
#restore true
This configuration file will be loaded by the main GoAccess container. That is why these lines are present in the Docker Compose file:
    command:
      - --no-global-config
      - --config-file=/srv/config/goaccess.conf
Start and verify
When everything is ready and the files are saved, start building the stack:
docker compose up -dYou can also display the logs to make sure everything is going well:
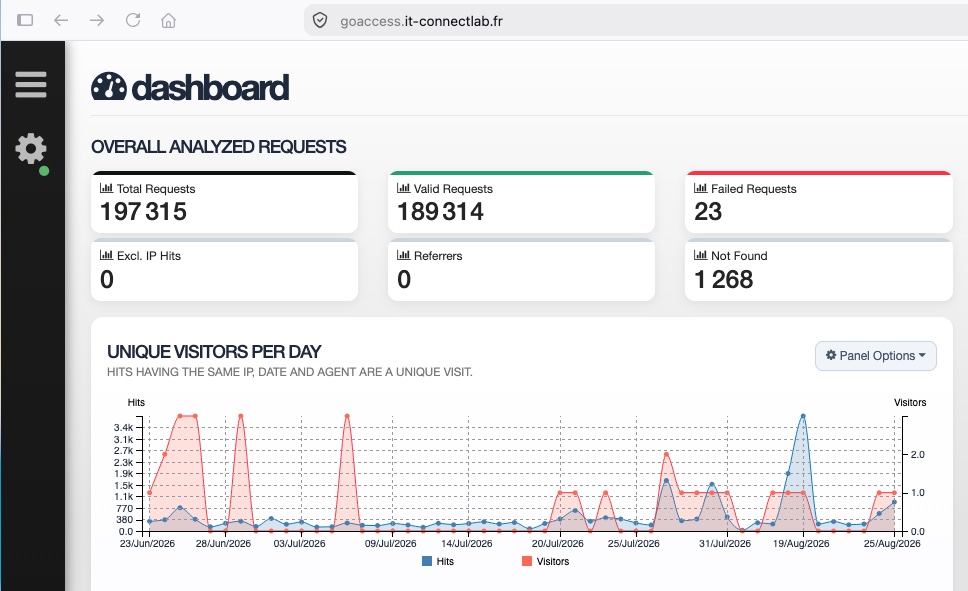
docker compose logs -f goaccessThe report is accessible at https://goaccess.it-connectlab.fr. It shows Traefik access logs with a refresh every second.
Then uncomment restore true, and restart with docker compose restart goaccess.
Warning: this report exposes IP addresses, internal URLs, and browsing habits. Never place it in a public web directory without authentication. A page protected by TinyAuth, Authentik, etc... or simple HTTP authentication solves the problem.
Automating report generation
GoAccess can preserve its data between runs, which avoids rereading everything each time and makes it possible to keep history beyond log rotation. I mentioned this earlier when discussing the --persist and --db-path options.
Here is how you can take advantage of this directly through the goaccess command, without managing a configuration file as we just did. This can be useful for automating report generation by running the command periodically.
# Premier passage : on constitue la base
sudo goaccess /var/log/nginx/access.log --log-format=COMBINED --persist --db-path=/var/lib/goaccess/

# Passages suivants : on restaure, on ajoute, on conserve
sudo goaccess /var/log/nginx/access.log --log-format=COMBINED \
  --restore --persist --db-path=/var/lib/goaccess/ -o /var/www/html/rapport.html
The directory specified by --db-path must exist (the default value is /tmp, which should be avoided in production). All that remains is to schedule the second command, for example every hour, via a cron job or a systemd timer.
Conclusion
GoAccess occupies a special place: it is neither a full web analytics solution nor a heavy centralization stack. Yet it provides immediate visibility into what is really happening on a web server, with log reading and formatting done in just a few minutes. It is an essential tool if you host web services, and as you know, there are a lot of tools and solutions that come with a web interface...
FAQ
What is GoAccess?
GoAccess is a web log analyzer written in C and released under the MIT license (open source). It is designed to read web server access logs (Apache, Nginx, Caddy, Traefik, etc.) and display statistics in a dashboard, either directly in the terminal or as a ready-to-use report.
Is GoAccess free?
Yes. GoAccess is distributed under the MIT license and remains completely free. It is a true open source gem, and there are no commercial licenses.
How do you install GoAccess on Debian or Ubuntu?
To get the latest stable version, add the project’s official repository by storing its GPG key in /usr/share/keyrings/ and then declaring the repository with the signed-by option. Then install the package from that repository with apt install goaccess. This gives you the latest version.
What is the basic command to analyze an access.log file?
The command goaccess /var/log/nginx/access.log --log-format=COMBINED opens the dashboard in the terminal. Add -o rapport.html to generate an HTML report instead.
Which log formats does GoAccess support?
GoAccess provides predefined formats for Combined and Common (Apache, Nginx), their virtual-host variants, W3C (IIS), Squid, Caddy, Traefik, Amazon CloudFront, S3, ELB and ALB, as well as Google Cloud Storage. Any other format can be described manually using specifiers, so you are free to adapt it to your needs.
How do you generate an HTML report with GoAccess?
Use the -o option followed by a path ending in .html, for example goaccess access.log --log-format=COMBINED -o rapport.html. The generated file is self-contained and opens in any browser.
Does GoAccess work behind a reverse proxy?
Yes, under two conditions. The report must be launched with --ws-url pointing to the public wss:// URL, and the reverse proxy must be configured to relay WebSocket connections to the GoAccess listening port. We saw an example with Traefik.
How do you exclude bots from GoAccess statistics?
The --ignore-crawlers option excludes bots recognized by GoAccess. The complementary --unknowns-as-crawlers option classifies unidentified systems and browsers as bots, which further refines the measurement of human traffic.
How does GoAccess count unique visitors?
A unique visit is the combination of the same IP address, the same date, and the same user agent. Granularity can be refined to the hour or minute with the --date-spec option.
Does GoAccess keep statistics history?
Yes, thanks to incremental processing. The --persist and --restore options, combined with --db-path, save data to disk and reload it on the next launch. History therefore survives log rotation. But this is not the default behavior, so you must enable these options yourself (in the config or as command-line arguments).
Can GoAccess replace Google Analytics or Matomo?
Partially. GoAccess measures real traffic, including visitors using ad blockers, since it uses neither scripts nor cookies. However, it does not provide time on page, navigation paths, or conversion tracking. It may also be less accurate when identifying traffic generated by AI agents.
Is GoAccess GDPR-compliant?
GoAccess does not drop cookies or trackers, which places it outside the scope of consent requirements. However, it does process IP addresses, which are considered personal data. The --anonymize-ip option and the log retention period are up to you to define.