XDR : deployment of Wazuh to create a cybersecurity lab
Table of Contents
I. Introduction
In this article, we'll learn how to quickly and easily deploy the open source XDR solution Wazuh via Docker.
Wazuh is an open-source security event monitoring solution based on OSSEC. This solution acts as both SIEM (Security Information and Event Management) and XDR (eXtended Detection and Response) within an infrastructure.
Our aim here is to get up and running quickly on this solution, with a lightweight architecture that's quick to deploy. We'll also look at how to install the Wazuh agent on Windows and Linux systems. Finally, we'll visualize the status and configuration of these agents in the Wazuh interface.
The idea of this article is not to describe the complete installation of Wazuh in an enterprise environment, taking into account good deployment and security practices (certificates, passwords, redundancy, load). On the other hand, following this procedure will suit you perfectly if you want to deploy it in a cybersecurity lab, discover the solution quickly or even train yourself in XDR solutions.
Before moving on to deployment, let's take a quick look at what an XDR is and how it differs from an antivirus and an EDR.
II. Antivirus, EDR, XDR: what are the differences?
Antivirus is certainly the term most familiar to the general public, even if few non-technical users actually know how it works and what its role is. The main function of an antivirus is to protect the system from known threats. To do this, they use static analysis and, in particular, hashes to identify known malware. More advanced antivirus products (when they were the pinnacle of security solutions) also use sandboxes to run user-initiated programs in a controlled environment. These limited, monitored environments enable behavioral analysis by verifying the actions and communications of each program.
Attackers have nevertheless learned to bypass these static and dynamic analyses, which have begun to show their limitations in the face of sophisticated attacks. Today, effective monitoring of an information system requires the deployment of an EDR (Endpoint Detection & Response) on each of its component systems. EDRs use hooks, kernel-level interception points, to monitor program activity in real time. Where antivirus concentrates on malicious programs, EDRs enable precise monitoring of program and user behavior on the system. At the same time, they produce advanced telemetry on any activity they deem suspicious, and are able to block program execution, access to certain sensitive resources or isolate a compromised system from the network. This telemetry is then centralized within a single platform for viewing, managing and configuring all deployed agents. Some EDRs use AI and machine learning to identify suspicious behavior.
Finally, XDR (Extended Detection and Response) uses all this telemetry and security logs to correlate security events. Their primary function is to support security analyses through their processing capabilities and rules.
Let's take the example of an attacker who is going to carry out a distributed brute force attack on a hundred or so systems. The correlation of events from these systems by XDR will enable them to be grouped together, issue a single alert and categorize it according to a TTP from the MITRE ATT& CK. Where individual telemetry of each system would have made it difficult to relate different events. What's more, the scope of XDR processing generally extends beyond endpoints (systems and servers) to include, for example, event logs, e-mails, network alerts, cloud alerts, Active Directory and so on.
The MITRE ATT&CK TTPs (Tactics, Techniques and Procedures) are a framework that categorizes and documents the attack methods used by attackers.
Of course, XDRs come with a host of advanced monitoring and security functions. But the central idea is to support the processing of numerous alerts and events, and to automate certain auditing, monitoring and protection actions.
III. Deploy Wazuh in single mode via Docker
A. Wazuh's main components
Wazuh is an XDR based on several roles that can be distributed over several systems (multi-node) or all grouped together on a single system (single-node). Of course, these two architecture choices depend on the load, available resources and the number of agents and events to be monitored. In general, a production deployment will be carried out on a multi-node system whereas deployment in a lab or for testing purposes will be on a single-node basis.
Let's take a look at the main components of a Wazuh installation:
- The indexer: stores and indexes generated alerts and reported events. It also provides data search, analysis and correlation capabilities. The indexer mainly uses the JSON format for key-value storage, facilitating data search and analysis.
- The Wazuh server (or manager): processes data received from agents in real time, using decoders and rules to detect indicators of compromise (IoC). It also manages agent communications, configurations and updates.
- The dashboard: this is the web interface that enables real-time data visualization and analysis, as well as numerous other functions such as alerts and reports.
- Agents: these are the Wazuh services installed and running on each endpoint (workstations, servers, virtual machines). They collect local activity and send telemetry and alerts to the manager for analysis, correlation and visualization.
Here is a simplified schematic view of the various components:
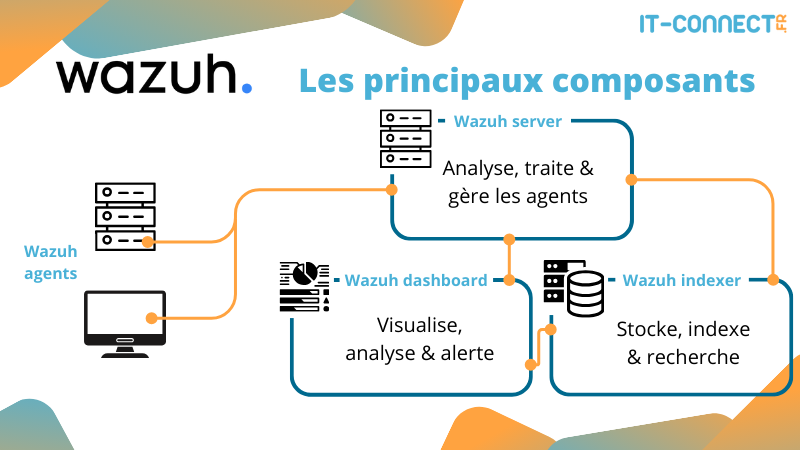
In this view, I've represented each component on a dedicated server for greater clarity. This architecture corresponds to a multi-node deployment. This makes it easier to manage heavy loads, notably through scaling. We could, for example, set up two Wazuh Servers (manager) if we have a huge number of agents. In this article, we're going to deploy these three components on the same host (single-node).
For a more complete overview, see the official Wazuh documentation: Wazuh components and data flow
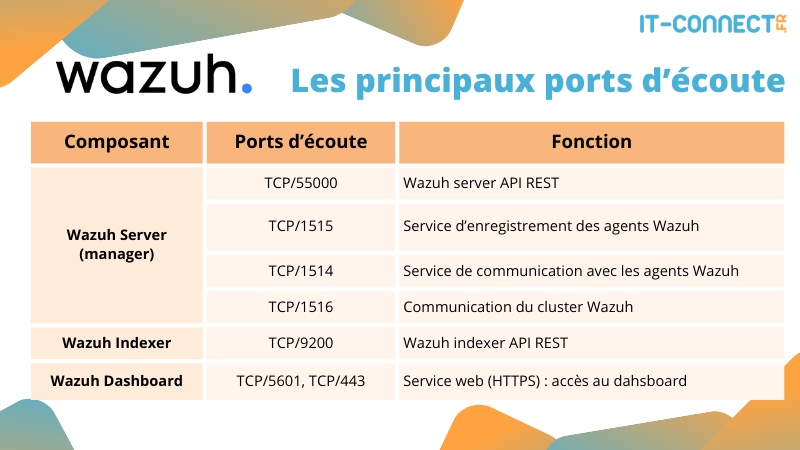
Also, here are the main ports that need to be exposed by these various components:
Deployment via Docker requires (automated) setup of a few volumes. These volumes make data persistent, which is always useful even for a lab.
As a reminder, no data persists in a Docker container once it has been shut down. To overcome this, a container can mount a host directory (such as a remote shared directory) and store data there. This is called a volume.
Once you've deployed your Wazuh infrastructure via Docker (next chapter), you can list these volumes with the following command:
$ docker volume ls

DRIVER    VOLUME NAME
local     single-node_filebeat_etc
local     single-node_filebeat_var
local     single-node_wazuh-dashboard-config
local     single-node_wazuh-dashboard-custom
local     single-node_wazuh-indexer-data
local     single-node_wazuh_active_response
local     single-node_wazuh_agentless
local     single-node_wazuh_api_configuration
local     single-node_wazuh_etc
local     single-node_wazuh_integrations
local     single-node_wazuh_logs
local     single-node_wazuh_queue
local     single-node_wazuh_var_multigroups
local     single-node_wazuh_wodles
B. Wazuh deployment
We're going to deploy Wazuh in single-node mode, i.e. with all three roles on the same system. To do this, we'll use Docker containerization, which makes deployment very quick and simple - perfect for testing!
Let's start by checking out the latest release of the wazuh-docker repository:
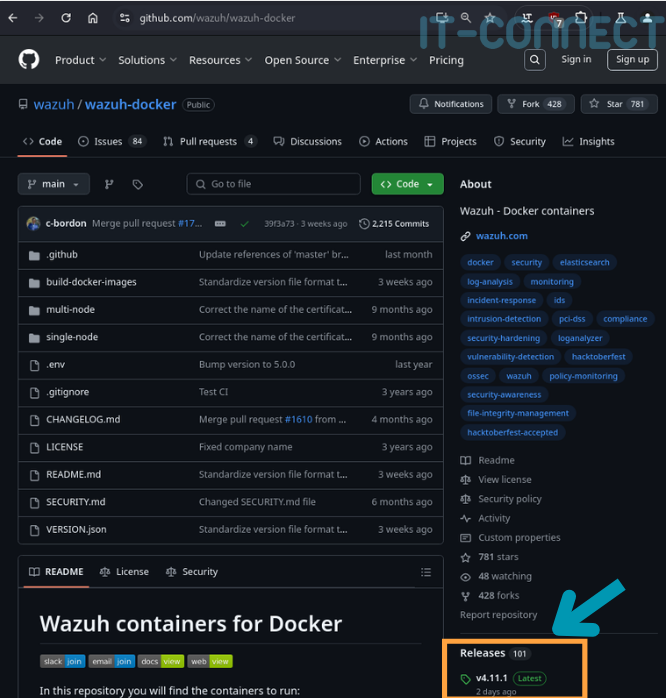
In my case, it's version 4.11.0, so you need to specify this version in the -b (--branch) to git (remember to update the version in the following command) :
git clone https://github.com/wazuh/wazuh-docker.git -b v4.11.0Then go to the wazuh-docker/single-node/, where you will find several folders and files:
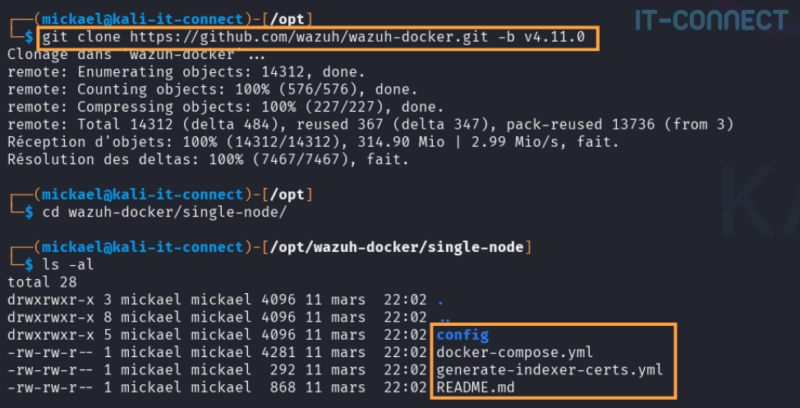
The file docker-compose.yml is the file used to deploy the various Wazuh components (indexer, manager, dashboard), each in a dedicated container. It's in this file that configuration elements relating to port exposure, relations between containers, volumes for storing persistent files on the host system, etc. are stored. I invite you to consult them if you're curious.
The file generate-indexer-certs.yml contains deployment instructions for a small container based on the Docker picture wazuh/wazuh-cert-tool. Its role is to automatically generate the SSL/TLS certificates required for the smooth operation and confidentiality of exchanges between the various Wazuh components.
In a real production infrastructure, you would of course need to use certificates signed with your in-house PKI, but this is a lab/test context.
Before deploying any Wazuh-related containers, you need to generate these certificates, which you can do with the following command:
docker compose -f generate-indexer-certs.yml upThis command creates different certificates in the following folder:
$ sudo ls /opt/wazuh-docker/single-node/config/wazuh_indexer_ssl_certs/ -al
total 56
dr-x------ 2 root    root            4096 11 mars  22:06 .
drwxrwxr-x 6 mickael mickael         4096 11 mars  22:06 ..
-r-------- 1 mickael mickael         1708 11 mars  22:06 admin-key.pem
-r-------- 1 mickael mickael         1119 11 mars  22:06 admin.pem
-r-------- 1 mickael mickael         1704 11 mars  22:06 root-ca.key
-r-------- 1 dnsmasq systemd-journal 1704 11 mars  22:06 root-ca-manager.key
-r-------- 1 dnsmasq systemd-journal 1204 11 mars  22:06 root-ca-manager.pem
-r-------- 1 mickael mickael         1204 11 mars  22:06 root-ca.pem
-r-------- 1 mickael mickael         1704 11 mars  22:06 wazuh.dashboard-key.pem
-r-------- 1 mickael mickael         1261 11 mars  22:06 wazuh.dashboard.pem
-r-------- 1 mickael mickael         1704 11 mars  22:06 wazuh.indexer-key.pem
-r-------- 1 mickael mickael         1257 11 mars  22:06 wazuh.indexer.pem
-r-------- 1 dnsmasq systemd-journal 1704 11 mars  22:06 wazuh.manager-key.pem
-r-------- 1 dnsmasq systemd-journal 1257 11 mars  22:06 wazuh.manager.pem
Now that our SSL/TLS certificates are ready, we can create and start our 3 Wazuh containers using the main configuration file :
docker compose -f docker-compose.yml upIn the logs displayed in your terminal (if you haven't used the -d), you can see the activity of three different containers, for example :
# Extract from container startup logs (terminal)
wazuh.dashboard-1  | {"type":"log","@timestamp":"2025-03-11T21:15:29Z","tags":["info","plugins","wazuh","monitoring"],"pid":54,"message":"Updated the wazuh-agent template"}
wazuh.indexer-1    | [2025-03-11T21:15:29,238][INFO ][o.o.c.m.MetadataUpdateSettingsService] [wazuh.indexer] updating number_of_replicas to [0] for indices [wazuh-monitoring-2025.11w]
wazuh.dashboard-1  | {"type":"log","@timestamp":"2025-03-11T21:15:29Z","tags" ["info","plugins","wazuh","monitoring"],"pid":54,"message":"Settings added to wazuh-monitoring-2025.11
w index"}
wazuh.manager-1    | 2025-03-11T21:15:34.047Z   INFO    log/harvester.go:302    Harvester started for file: /var/ossec/logs/alerts/alerts.json
[...]
If you see Java stack traces mentioning SSL/TLS in these logs, and logs appearing in a loop, there's probably a problem with the certificates. Check that you've taken the latest release of the repository wazuh-docker that you are not on the hand (option -b).
A few seconds after executing this command, you can enter (in another terminal) the following command to check the status of started containers:
docker ps -aHere are the expected views and statuses:
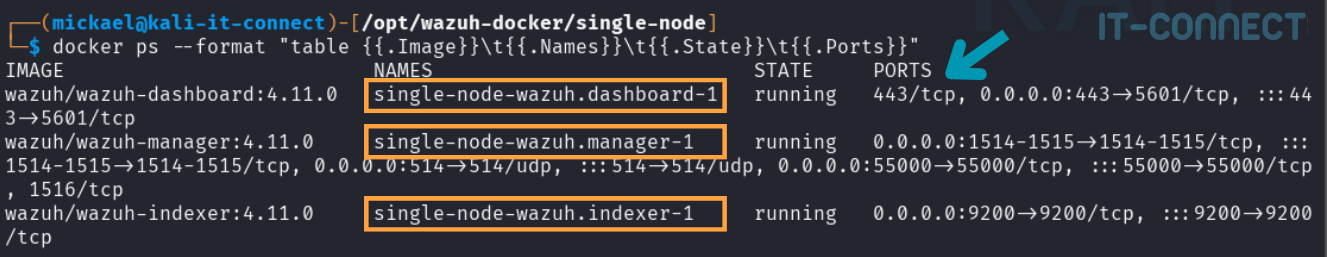
In particular, it shows the network ports exposed by each container. You can now visit the following URL via a browser: https://localhost
Once you've agreed to use an unsecured connection (self-signed certificate), you'll be presented with the XDR Wazuh login page. Here are the logins to use: admin:SecretPassword
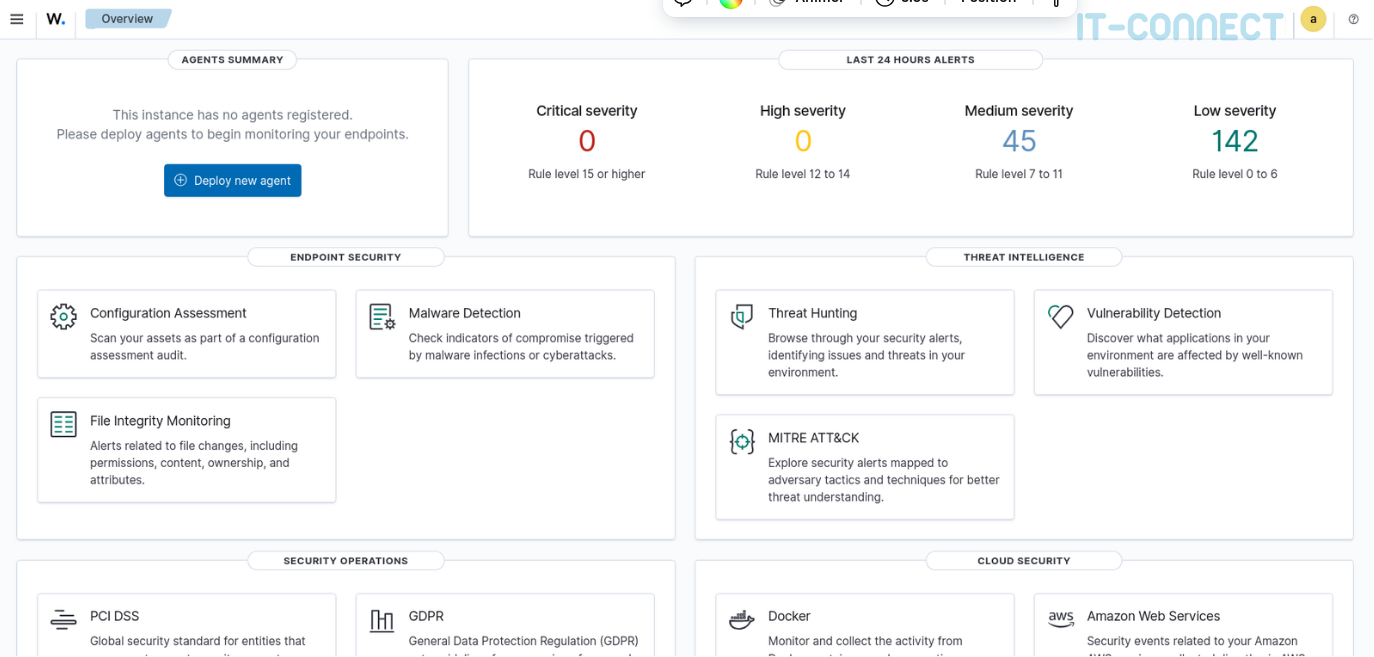
And now our Wazuh is installed! You can now navigate the management and configuration interface.
IV. Adding Wazuh Windows and Linux agents
A. Deploying the Wazuh agent on Windows
Let's move on to the deployment of a Wazuh agent on a Windows system. This will give us our first feedback and dashboard data.
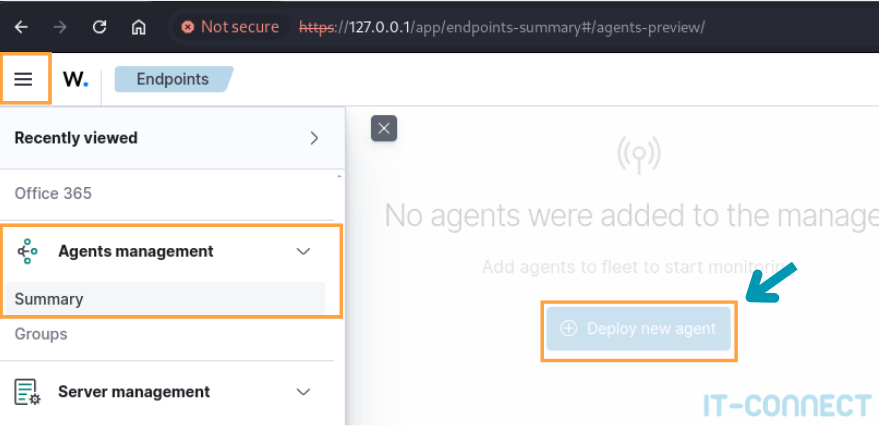
In the dashboard, go to Agents Management > Summary, you will then have access to a page containing a Deploy new agent button:
On this new page, you'll need to select MSI 32/64 bits in the Windows insert and enter the IP address of the Wazuh Server :
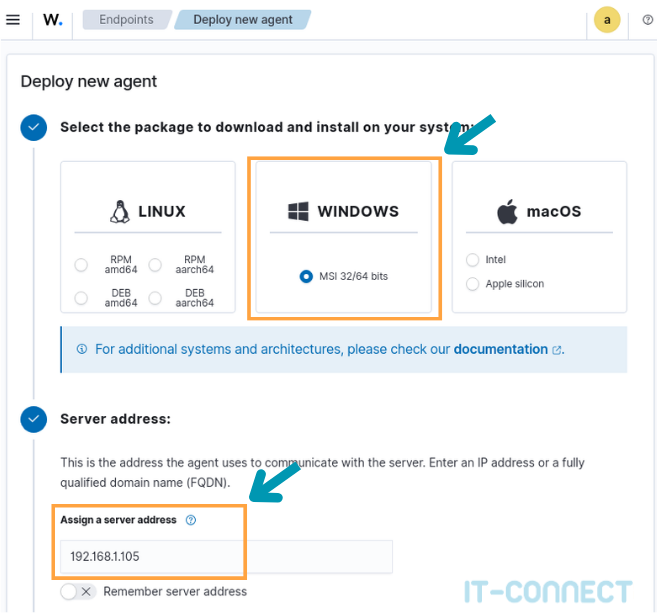
Optionally, you can also enter the name you wish to give the agent when it appears in the interface. By default, agents take the name of the host on which they are running.
This configuration allows you to fill in a PowerShell command line, which you will find at the bottom of the page:
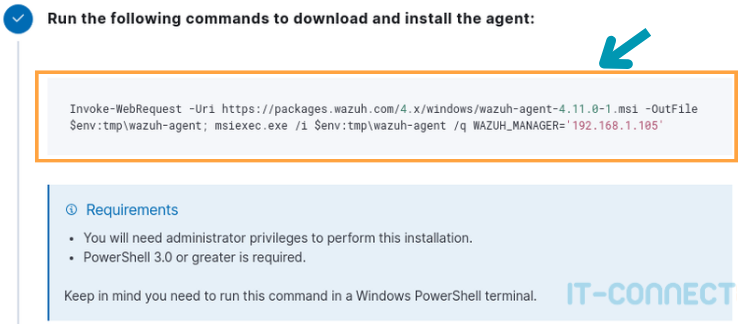
Simply copy/paste this PowerShell command line into a terminal launched as administrator. It takes care of :
- Download the Wazuh agent from the official source in the correct version;
- Run the installer with the Wazuh server to be contacted as parameter.
In cases where your system does not have direct access to the Internet, you can of course proceed in three steps:
- Manually download the
.msiinstaller onto a ; - Transfer it to the target host ;
- Run the installation command line.
By default, the installation binary supplied by Wazuh is unsigned. When used via msiexec.exe, this results in a " Unable to open this installation package. Check that it exists and that you are authorized to access it, or check with your application reseller that this Windows Installer package is valid." :
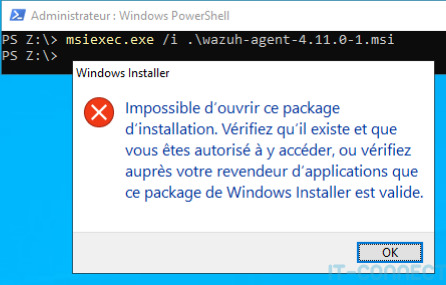
And, double attention, using the /q option (/quiet) of msiexec.exe in the default command line hides this error message!
For an installation that's not fussy about this point (in the case of a lab), we're going to deploy it by hand. To do this, we need to directly execute the .msi by double-clicking on it (as administrator). Then click on Exécuter in the security warning window (also due to the unsigned binary). The rest of the installation is fairly straightforward.
Once this has been done, it is necessary to request a registration key from the server using the following command (to be executed via a PowerShell terminal):
&"C:\Program Files (x86)\ossec-agent\agent-auth.exe" -m <IP Wazuh Server>This command allows the Wazuh agent to register with the Wazuh server:
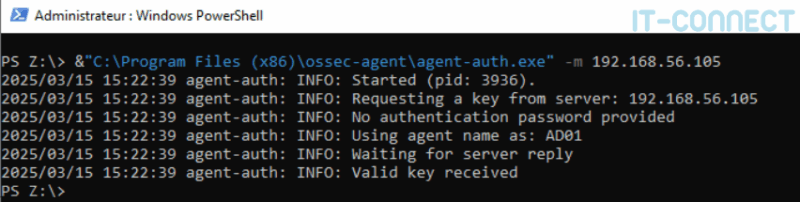
An authentication request is sent (in this case, no password is required - we're in a lab). The server then sends back a key, specific to the agent, which will be used to authenticate and encrypt exchanges. This key can be found in the C:\Program Files (x86)\ossec-agent\client.keys.
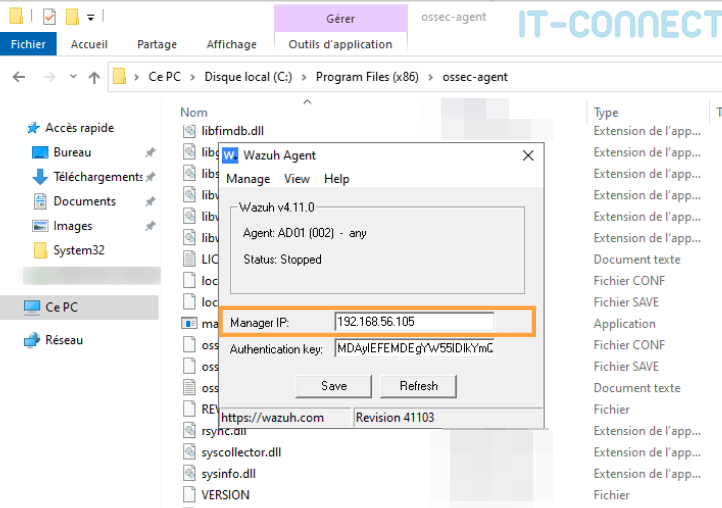
Next, we're going to run the win32ui program, located in the C:\Program Files (x86)\ossec-agent folder. In the window that opens, the authentication key has already been entered. All that remains is to enter the IP address of the Wazuh Server and click on Save:
Lastly, start the Wazuh server with the following command line from a PowerShell terminal running as administrator:
PS Z:> NET START WazuhSvc
Le service Wazuh a démarré.
For clean, automated and silent deployment, you'll need to pre-sign the binary with your internal PKI. Another option would be to disable the SmartScreen filter, which protects workstations against the execution of unrecognized/signed binaries from the Internet, but this is not recommended at all.
To check that your Wazuh agent is deployed and active, here are a few debug commands and the expected result (remember to adapt the PID):
# Check Wazuh service status
PS Z:> get-service -Name WazuhSvc

Status   Name               DisplayName
------   ----               -----------
Running  WazuhSvc           Wazuh

# Check that the wazuh-agent.exe process is running (PID: penultimate column)
PS Z:> ps |findstr "wazuh"
    514      24    23804      38028       9,00   4300   0 wazuh-agent

# Check that communication is established on port 1514 between the agent (PID) and the Wazuh server
PS Z:> netstat -ano |findstr "4300"
  TCP    192.168.56.102:61438   192.168.56.105:1514    ESTABLISHED     4300
If you're curious, you'll find the Wazuh agent's configuration elements in the C:\Program Files (x86)\ossec-agent folder. The ossec.conf file contains all the information relating to the Wazuh Server, useful in the event of an IP change.
Our Wazuh agent is now deployed on Windows, so let's move on to deployment on a Linux system before viewing their activity in the Wazuh console.
B. Deploying the Wazuh agent under Linux
For Linux deployment, let's go back to Agents Management > Summary > Deploy New Agent.
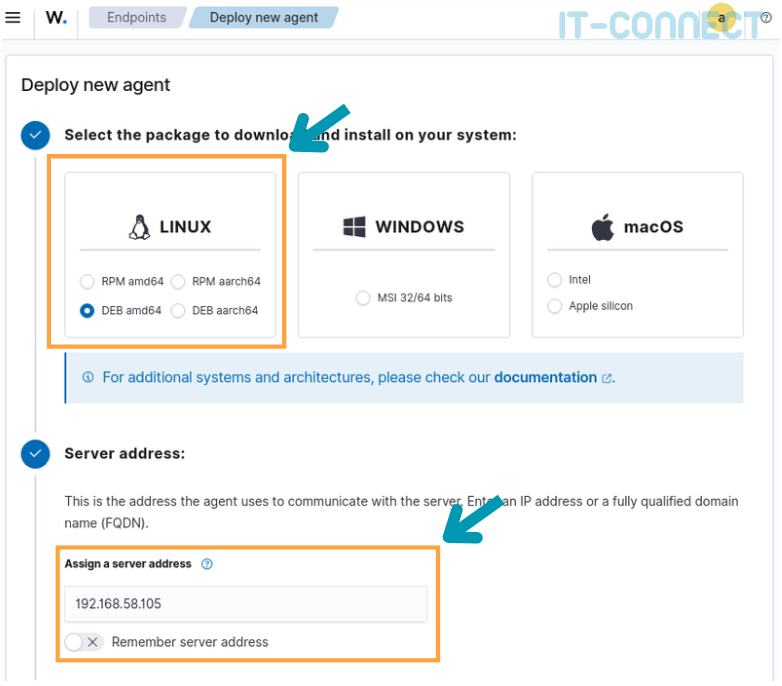
Here we'll click on Deb amd64 in the Linux insert (in my lab, I'm running Debian), fill in the server's IP address as before under Windows, and retrieve the command line at the bottom of the page:
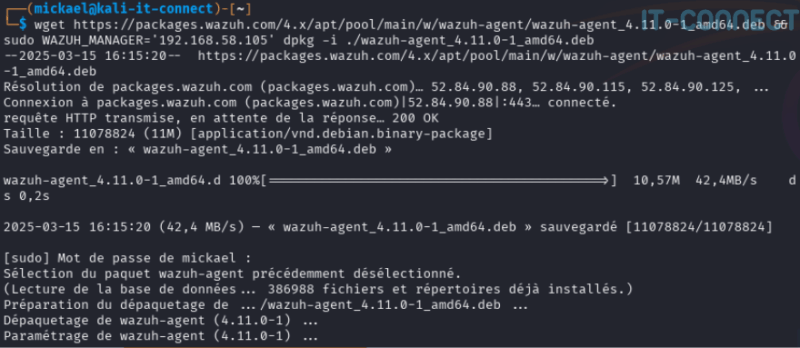
Under Linux, we don't have to worry about signing binaries. The command line allows trouble-free installation of the agent and its services. We do, however, need to generate a key that will be used to authenticate our agent and encrypt exchanges (from a terminal as root) :
$ /var/ossec/bin/agent-auth -m 192.168.56.105
2025/03/15 16:23:33 agent-auth: INFO: Started (pid: 91509).
2025/03/15 16:23:33 agent-auth: INFO: Requesting a key from server: 192.168.56.105
2025/03/15 16:23:33 agent-auth: INFO: No authentication password provided
2025/03/15 16:23:33 agent-auth: INFO: Using agent name as: kali-it-connect
2025/03/15 16:23:33 agent-auth: INFO: Waiting for server reply
2025/03/15 16:23:33 agent-auth: INFO: Valid key received

$ cat /var/ossec/etc/client.keys
003 kali-it-connect any 538d20c3918e0bbf071f711edd67f498bea85ddd1d149a4befdf6995c42adfe2
Once this is done, we need to start the service wazuh-agent. We will execute these three command lines from a privileged terminal (root) :
sudo systemctl daemon-reload
sudo systemctl enable wazuh-agent
sudo systemctl start wazuh-agent
As with Windows, you can confirm that your agent is running with the following debug commands:
# Check wazuh-agent service status
$ systemctl status wazuh-agent
wazuh-agent.service - Wazuh agent
     Loaded: loaded (/usr/lib/systemd/system/wazuh-agent.service; enabled; preset: disabled)
     Active: active (running) since Fri 2025-03-15 16:25:54 CET; 16s ago
 Invocation: 94720a2045cd48a2a3a44aff3141933b
    Process: 92810 ExecStart=/usr/bin/env /var/ossec/bin/wazuh-control start (code=exited, status=0/SUCCESS)
      Tasks: 31 (limit: 9388)
     Memory: 12.9M (peak: 21.3M)
        CPU: 456ms
     CGroup: /system.slice/wazuh-agent.service
             ├─92833 /var/ossec/bin/wazuh-execd
             ├─92852 /var/ossec/bin/wazuh-agentd
             ├─92873 /var/ossec/bin/wazuh-syscheckd
             ├─92883 /var/ossec/bin/wazuh-logcollector
             └─92908 /var/ossec/bin/wazuh-modulesd
[...]

# Check network communication between agent and Wazuh Server
$ ss -petulan |grep wazuh
tcp   ESTAB      0      0      192.168.56.105:57912  192.168.56.105:1514 users:(("wazuh-agentd",pid=98231,fd=8))                                         uid:119 ino:369001 sk:2004 cgroup:/system.slice/wazuh-agent.service <->

# Check wazuh-agentd process activity
$ ps -edf |grep wazuh-agent
wazuh      92852       1  0 16:25 ?        00:00:00 /var/ossec/bin/wazuh-agentd
For the more inquisitive, you'll find the Wazuh agent configuration elements in the /var/ossec/etc/ directory:
$ ls /var/ossec/etc
client.keys  internal_options.conf  local_internal_options.conf  localtime  ossec.conf  shared  wpk_root.pem
The file ossec.conf contains all Wazuh Server information, useful in the event of an IP change.
Our Wazuh agent is now deployed on Windows and Linux. We have everything we need to start experimenting on a working platform. Let's take a quick tour of the dashboard to visualize our agents.
C. View and manage Wazuh agents
As with any agent-based centralization solution (EDR, XDR, etc.), we naturally have a page dedicated to their management within the Wazuh dashboard. Return to the Agents Management > Summary :
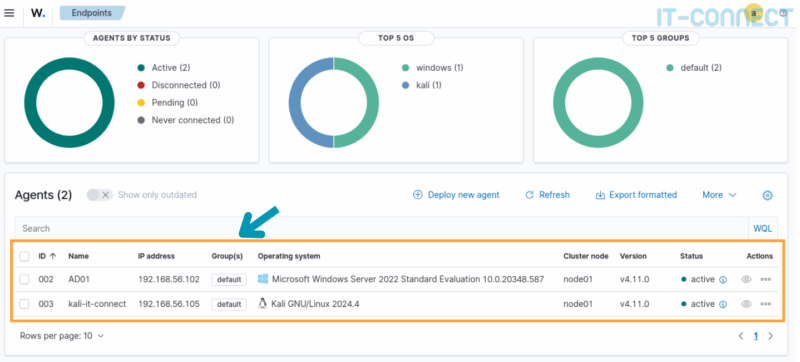
Here we see our two agents and associated information (ID, host name, IP, OS, status, etc.). Various statistics on status, OS and agent groups are also displayed. These are particularly useful in enterprise infrastructures handling dozens or hundreds of agents. In particular, we can divide our agents into groups, enabling us to apply different configurations to them according to OS or criticality.
This page also lets you manage agents and their configurations remotely. But we'll probably deal with this in future articles.
V. Conclusion
In this article, we look at how to get up and running quickly on the open-source XDR Wazuh solution. After deploying it via Docker as a single-node, we deployed an agent on Windows and Linux.
Wazuh is an open-source solution, and like all XDRs, it's packed with great features. As part of a cybersecurity lab, this solution lets you see the effects of a cyberattack and practice managing, configuring and visualizing security events.
I encourage you to go further in your discovery of Wazuh. In the meantime, don't hesitate to post your opinions and questions in the comments or come and discuss them on our Discord server.