Linux : send logs to Graylog with rsyslog
Table of Contents
I. Introduction
In this tutorial, we'll learn how to configure a Linux machine to send its logs to a Graylog server. To do this, we'll install and configure Rsyslog on the system.
To follow this tutorial, you need a Graylog server and a Linux machine (Debian, Ubuntu, Rocky Linux, etc.). As a reminder, in a previous article, we learned how to install Graylog on Debian :
The installation of Graylog will not be covered in this tutorial, but we will see how to configure our log sink to receive logs from Linux machines. For my part, the machine which is to send its logs to Graylog is a machine named "srv-docker" running Debian 12.
II. Configuring Graylog to receive Linux logs
We'll start by configuring Graylog. There are three steps to complete:
- The creation of an Input to create an entry point for Linux machines to send Syslog logs via UDP.
- Creation of a new Index to store and index all Linux logs.
- Creation of a Stream to route logs received by Graylog to the new Linux Index.
A. Create an Input for Syslog
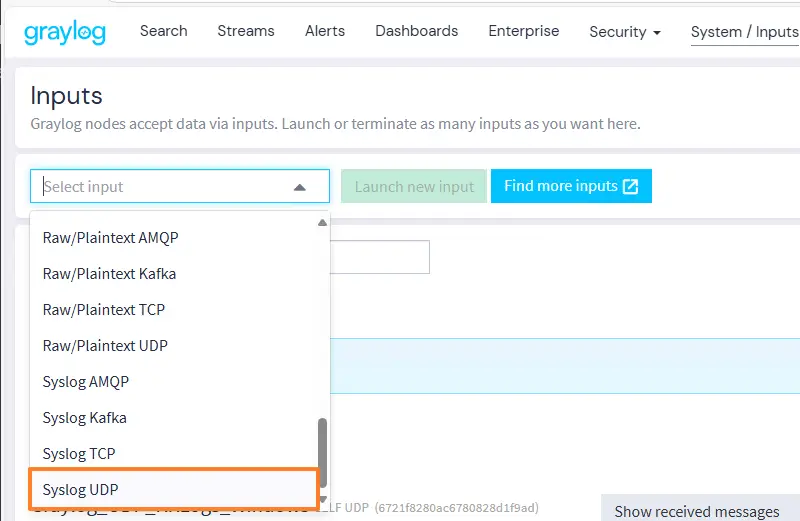
Log on to the Graylog interface, click on "System" in the menu and then on "Inputs". In the drop-down list, select "Syslog UDP", then click on the "Launch new input" button. It is also possible to create a TCP Syslog Input, but this requires the use of a TLS certificate: this is a plus for security, but will not be discussed in this article.
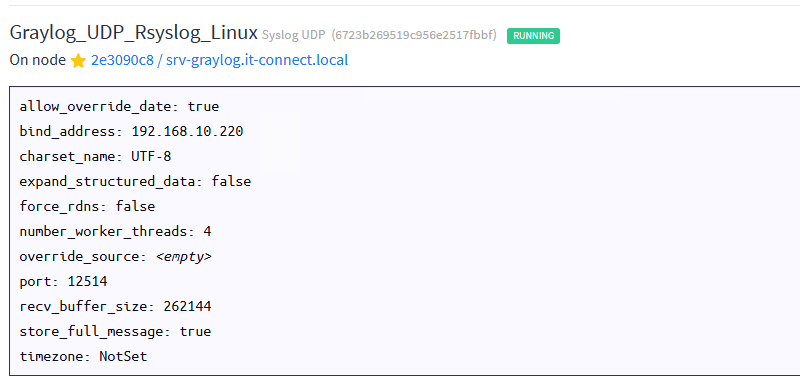
A wizard will appear on the screen. Start by giving this Input a name, e.g. "Graylog_UDP_Rsyslog_Linux", and choose a port. The default port is "514" but you can customize it. Here, port "12514" is selected.
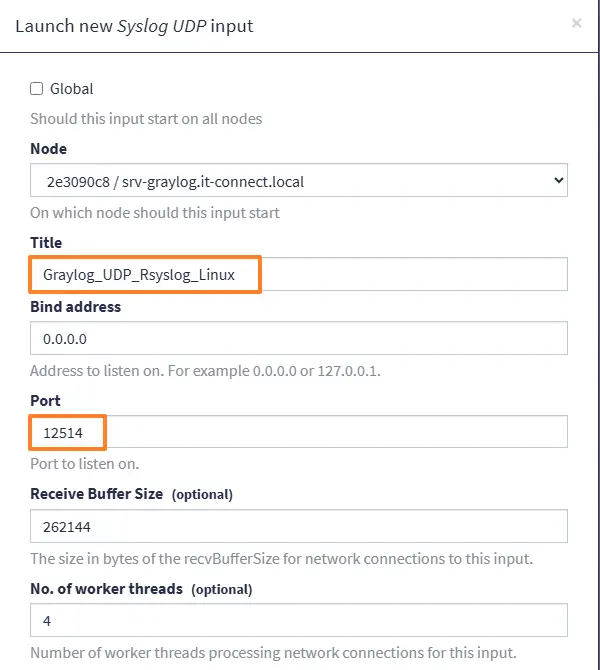
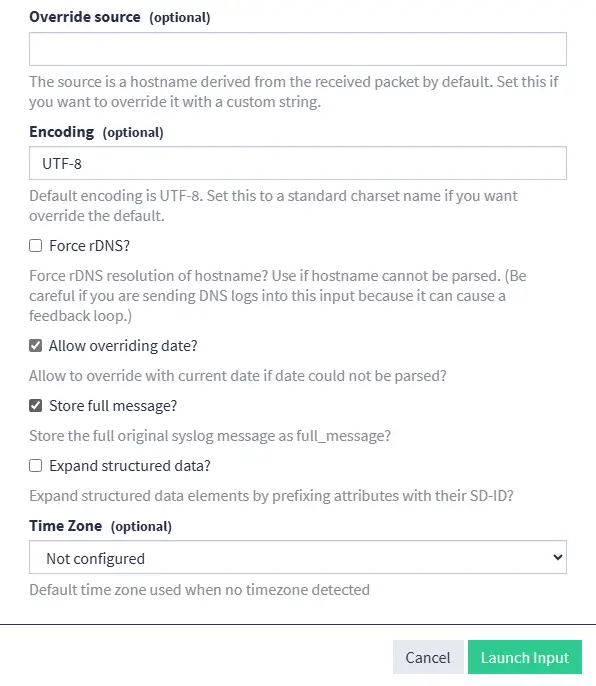
You can also check the "Store full message" option to store the full log message in Graylog. Click on "Launch Input".
The new Input has been created and is now active. Graylog can now receive Syslog logs on port 12514/UDP, but we haven't finished configuring the application yet.
Note : a single Input can be used to store logs from several Linux machines.
B. Create a new Linux Index
We need to create an Index in Graylog to store logs from Linux machines. An index in Graylog is a storage structure that contains received logs, i.e. messages received. Graylog uses OpenSearch as its storage engine, and messages are indexed to enable fast, efficient searches.
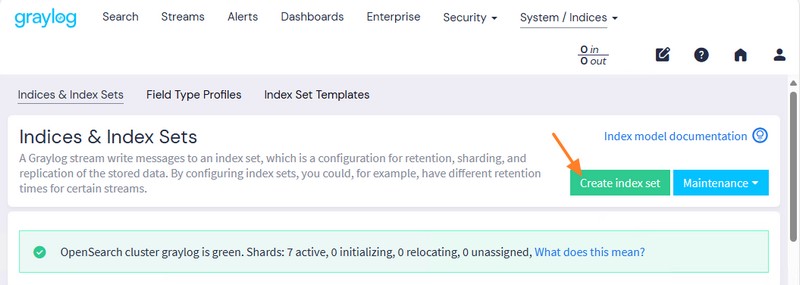
From Graylog, click on "System" in the menu, then on "Indices". On the new page that appears, click on "Create index set".
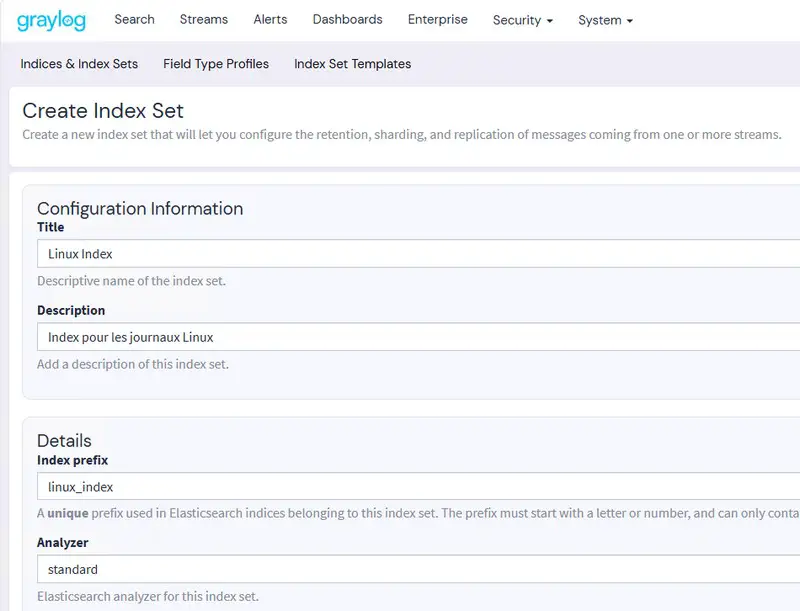
Name this index, for example "Linux Index", add a description and a prefix, before confirming. Here, we'll store all Linux logs in this index. It is also possible to create specific indexes to store only certain logs (SSH logs, Web service logs, etc.).
Now we need to create a new stream to route messages to this index.
C. Create a Stream
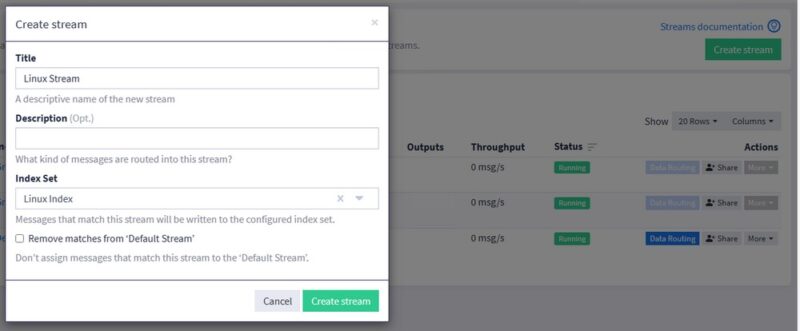
To create a new stream, click on "Streams" in Graylog's main menu. Then click on the "Create stream" button on the right. In the window that appears, name the stream, e.g. "Linux Stream", and choose the "Linux Index" for the "Index Set" field. Confirm your choice.
Note : messages corresponding to this stream will also be included in the "Default Stream", unless you check the "Remove matches from 'Default Stream'" option.
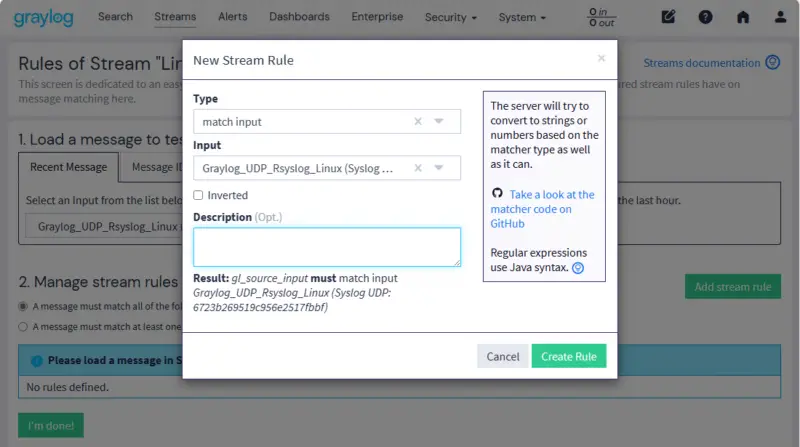
Then, in your steam settings, click on the "Add stream rule" button to add a new message routing rule. If you can't find this window, click on "Streams" in the menu, then on the line corresponding to your stream, click on "More" then "Manage Rules".
Choose the "match input" type and select the Rsyslog UDP input created earlier. Confirm with the "Create Rule" button. All messages to our new Input will now be sent to the Index for Linux.
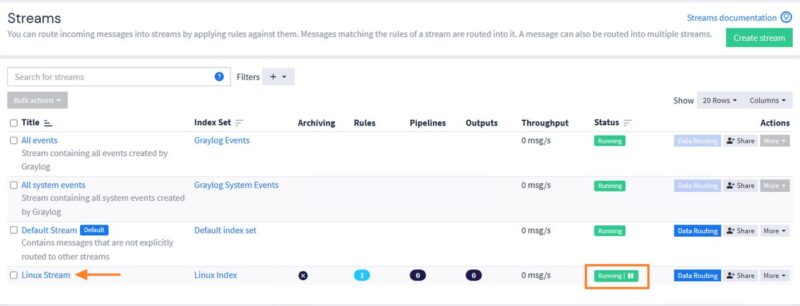
Your new Stream should appear in the list and be in "Running" state. The message bandwidth shows "0 msg/s", as we are not currently sending any logs to the Rsyslog UDP input. To view a stream's logs, simply click on its name.
Everything's ready on the Graylog side. The next step is to configure the Linux machine.
III. Installing and configuring Rsyslog on Linux
Log on to the Linux machine, either locally or remotely, and use a user account with permissions to elevate its privileges (via sudo). Otherwise, use the "root" account directly.
A. Installing the Rsyslog package
Start by updating the package cache and installing the "rsyslog" package.
sudo apt-get update
sudo apt-get install rsyslog
Then check the service status. In most cases, it's already running.
sudo systemctl status rsyslogB. Configuring Rsyslog
Rsyslog has a main configuration file located here:
/etc/rsyslog.confIn addition, the "/etc/rsyslog.d/" directory is used to store additional configuration files for Rsyslog. In the main configuration file, there is an Include directive to import all ".conf" files located in this directory. This makes it possible to have additional files for configuring Rsyslog without modifying the main file.
In this directory, you must use numbers to define the loading order, because files are loaded in alphabetical order. Adding a numerical prefix allows you to manage the priority between several configuration files. Here, we only have one additional file, so it's not a problem.
In this directory, we will create a file called "10-graylog.conf" :
sudo nano /etc/rsyslog.d/10-graylog.confIn this file, insert this line :
*.* @192.168.10.220:12514;RSYSLOG_SyslogProtocol23FormatHere's how to interpret this line:
- *.* : means to send all Syslog logs from the Linux machine to Graylog.
- @: indicates that the transport is carried out in UDP. To switch to TCP, specify"@@".
- 192.168.10.220:12514: indicates the address of the Graylog server, as well as the port on which logs are sent (corresponding to Input).
- RSYSLOG_SyslogProtocol23Format: format of messages to be sent to Graylog.
When done, save the file and restart Rsyslog.
sudo systemctl restart rsyslog.serviceFollowing this action, the first messages should arrive on your Graylog server!
IV. Displaying Linux logs in Graylog
From Graylog, you can click on "Streams" and select your new stream to display the associated messages. Alternatively, click on "Search" and select your Steam and launch a search.
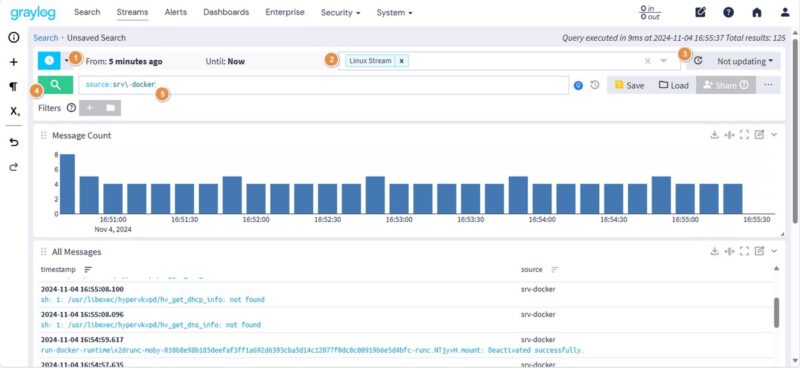
Here are some key elements of the interface:
1 - Select the period for which to display messages. By default, messages from the last 5 minutes are displayed.
2 - Select the stream(s) to display.
3 - Enable automatic refresh of the message list (every 5 seconds, for example). Otherwise, it's static and you'll have to refresh it manually.
4 - Click on the magnifying glass to launch the search after modifying the period, stream or filter.
5 - Input bar to specify your search filters. Here, I specify "source:srv-docker" to display only the logs of the new machine on which I've just set up Rsyslog.
Logs are sent by the Linux machine:
V. Identifying an SSH connection failure
Graylog's strength lies in its ability to index logs and enable searches to be carried out according to various criteria: source machine, timestamp, message content, etc... We could be looking to identify failed SSH connections.
From a remote machine (the Graylog server, for example), try to connect to your Linux server on which you've just configured Rsyslog. For example:
ssh flo@srv-docker.it-connect.localThen deliberately enter an incorrect username and password, in order to generate connection errors. In the "/var/log/auth.log" file, this will generate log messages similar to the following:
Failed password for invalid user it-connect from 192.168.10.199 port 50352 ssh2You should find these messages on Graylog.
On Graylog, use the following search filter to display only matching messages:
message:Failed password AND application_name:sshdIf you have several servers and wish to analyze the logs of a specific server, specify its name in addition :
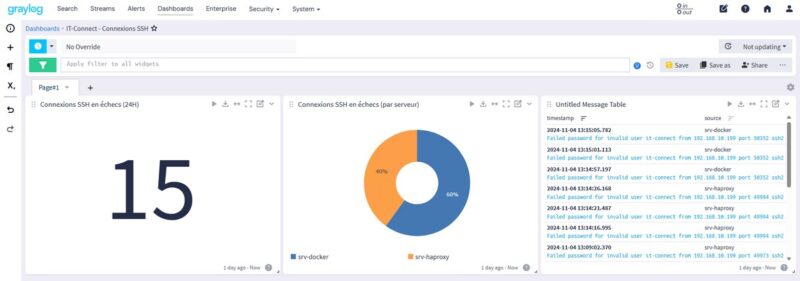
message:Failed password AND application_name:sshd AND source:srv-dockerHere's an overview of the result on a machine where I generated several connection errors, at different times of the day:
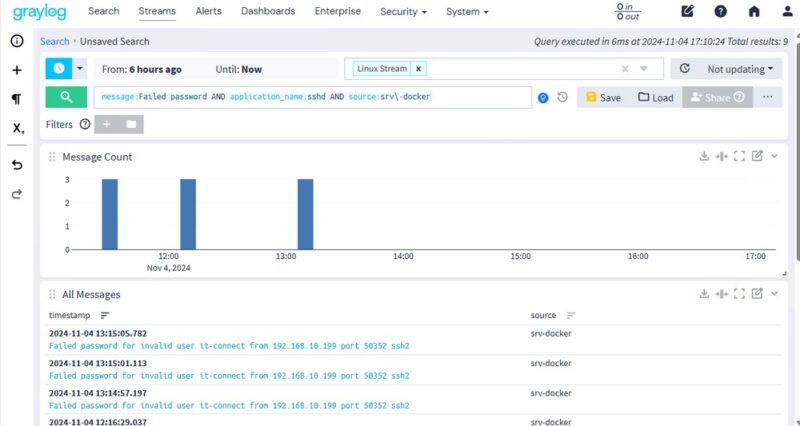
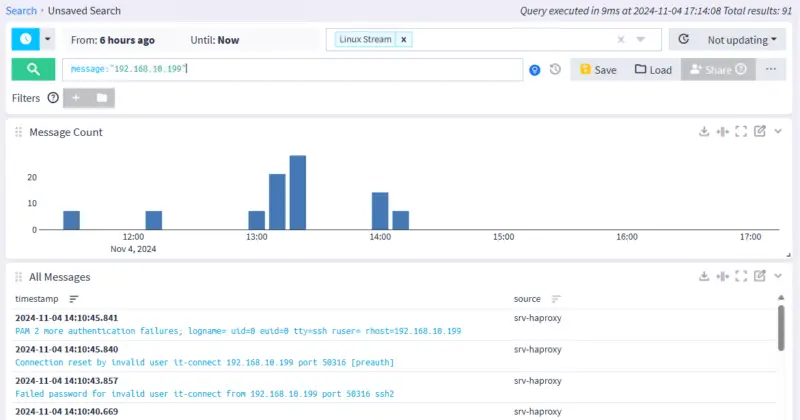
Unsuccessful connection attempts are made from the machine with IP address "192.168.10.199". If you'd like to know more about the activity of this host, you can perform a search on this IP address. Graylog will output all logs where this IP address is referenced, on all hosts (for which log sending is configured).
In this case, the filter to be used can be :
message:"192.168.10.199"We get additional results (not surprising, since we don't filter on the SSH application):
VI. Conclusion
By following this tutorial, you should be able to configure a Linux machine to send its logs to a Graylog server. This way, you'll be able to centralize the logs of your Linux hosts in your log sink!
To go even further, consider creating dashboards and alerts to receive notification when an anomaly is detected.